Let me choose between a Histogram Display and a Waveform Display while editing.
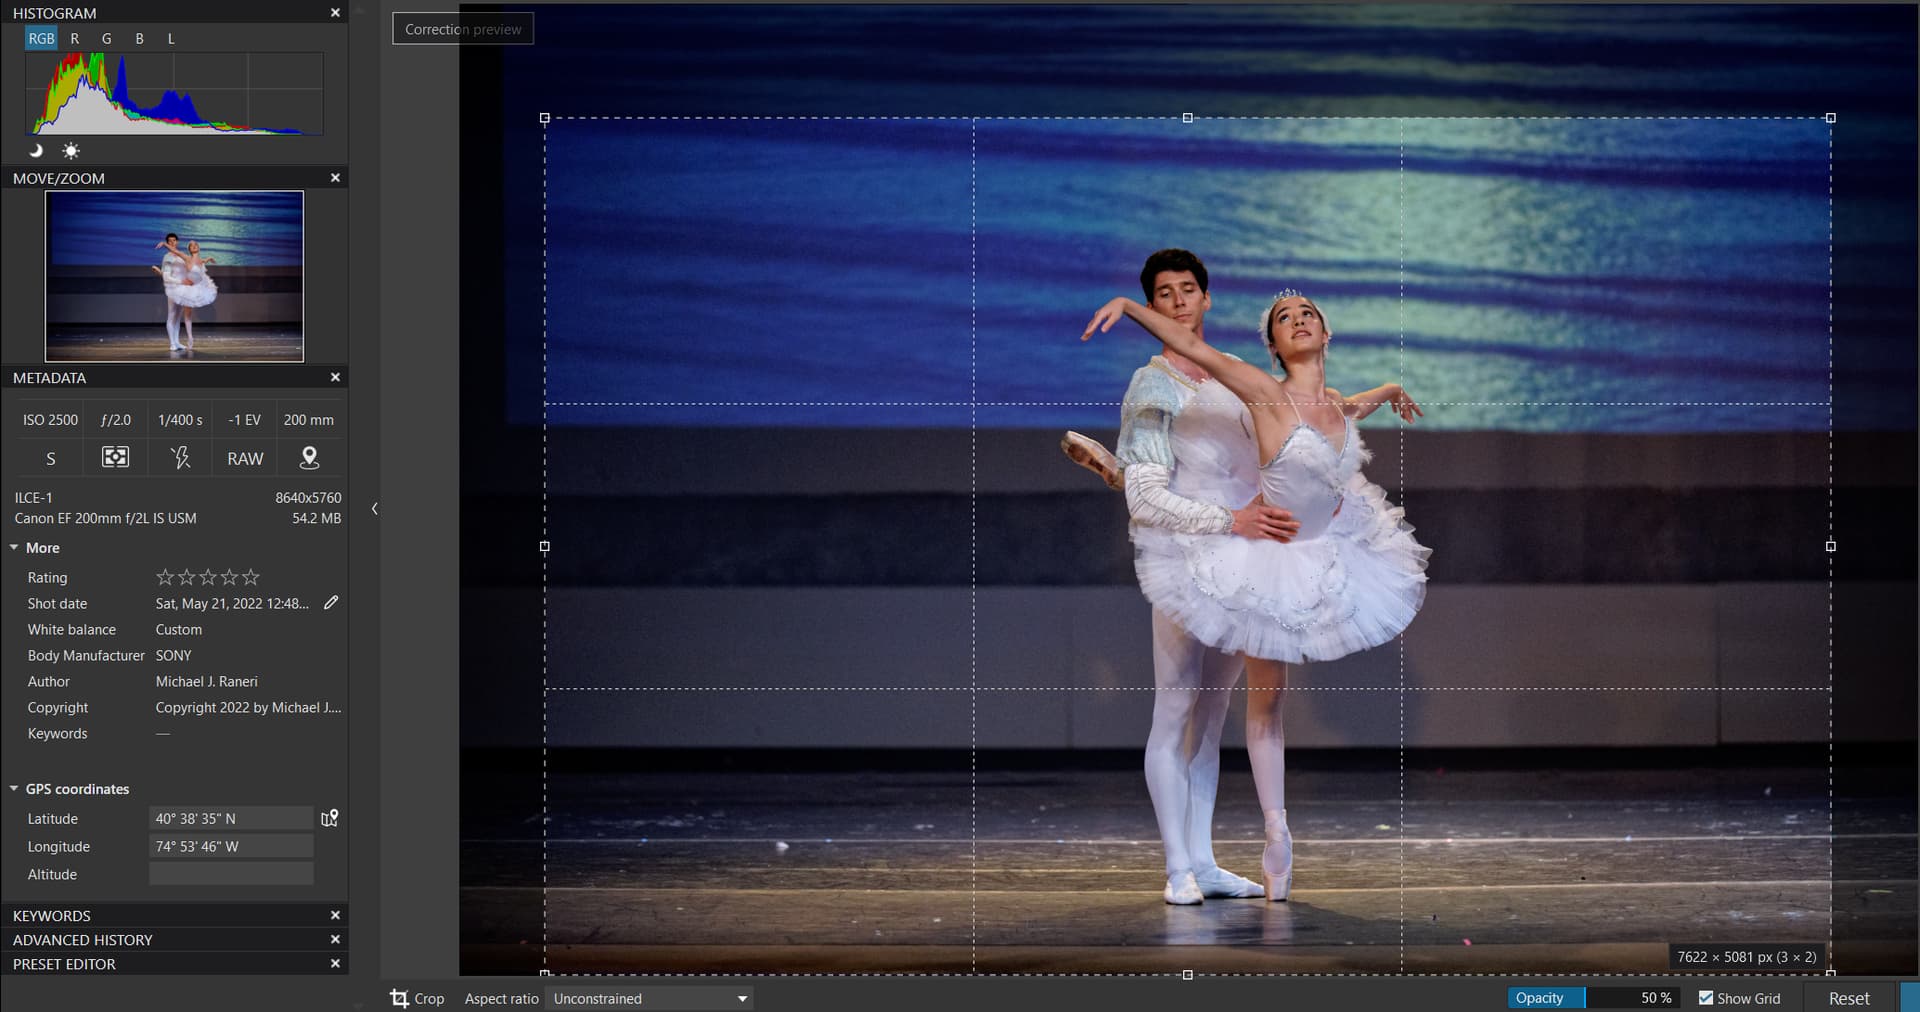
Having done some color grading and using a waveform display as opposed to a histogram I’ve really seen the benefit of this alternative display. Basically it’s a histogram like display that slices your image vertically so you can see where the different shades in the histogram appear. As an example take the image below. It’s difficult to tell at what levels the different elements of the image are as the histogram shows the distribution of shades over the whole image. The waveform shows the distribution of shades as you move from left to right, so you can see things like falloff on the sides of the frame, and much more detail in the areas of your image of interest (in this case the two dancers.)
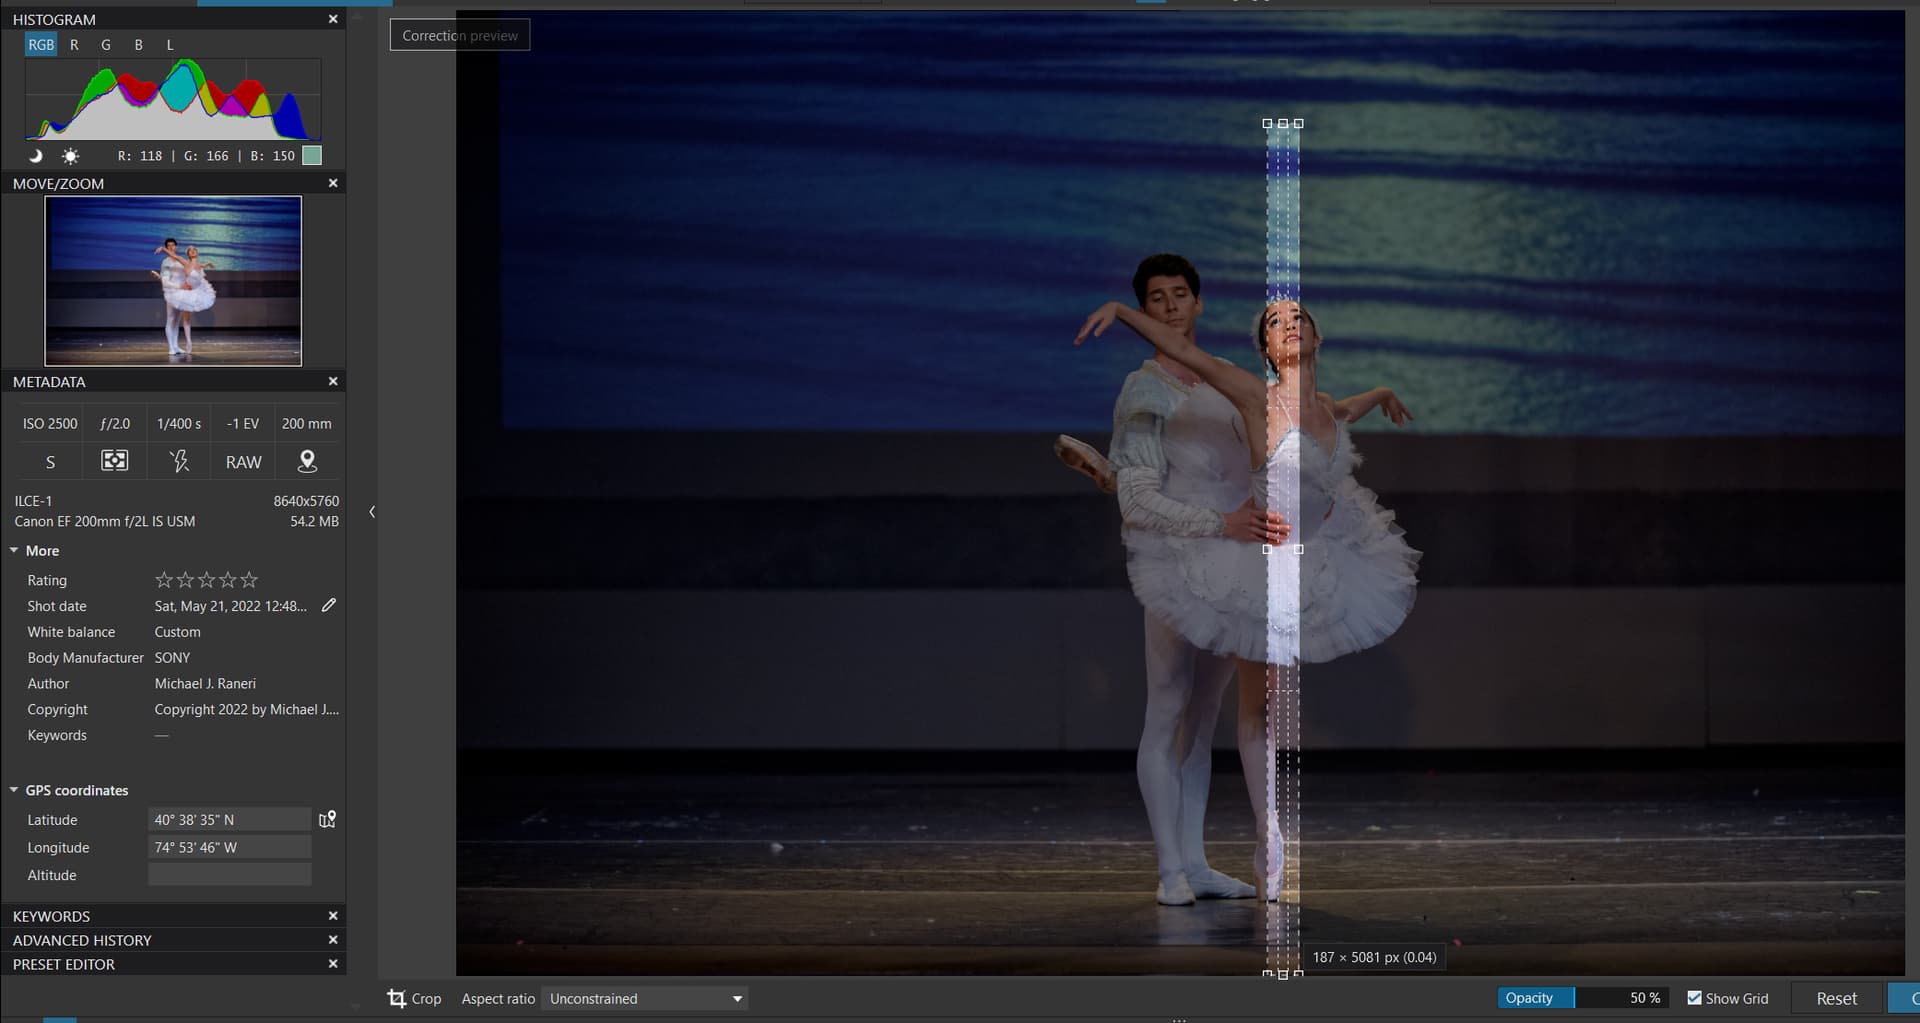
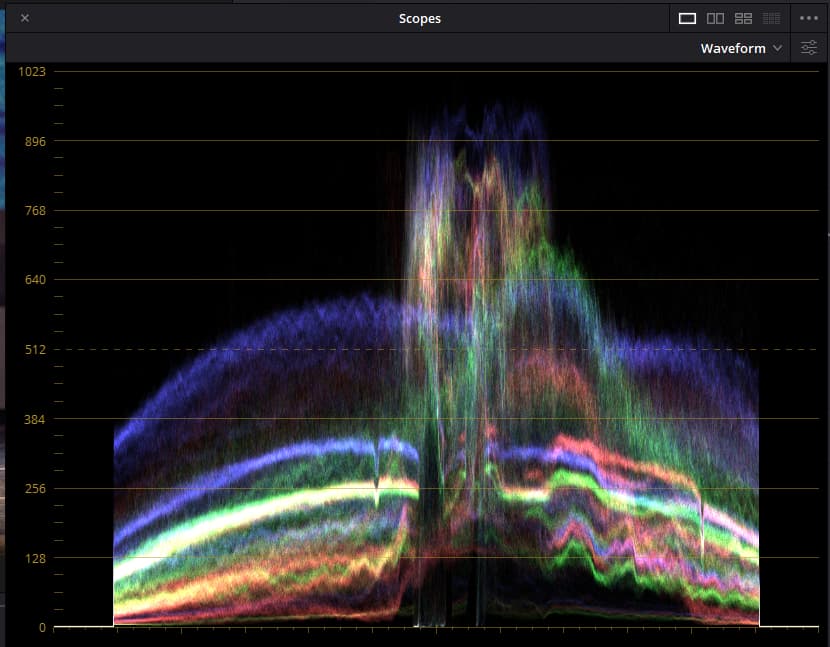
While it looks like a lot to absorb, once you get acclimated to what you’re looking at, this is a very intuitive way at looking at the color data. In this example you can see the histogram like data for the subject (in the center, horizontally) which is separable from the histogram data from the background (either on the left and right). It even allows you to see the rippling on the background right side. Overall there’s much more information here.
There really aren’t any photo editing tools that offer this kind of a display, but I assure you everyone who goes from video editing to photo editing wishes their photo editor had a waveform display.
Here’s a decent explanation of how waveforms work.
I find this a very techie-driven invention to satisfy those who want to rely on yet another gizmo instead of learning how to measure exposure correctly.
The whole video is aimed at using the waveform vs the histogram at the time of taking the shot, not at using it for post processing.
I never use the histogram, or even the back screen, to determine the exposure for a shot. I took the time to learn the limits of my sensor and simply spot read the brightest part of the scene and place that at a maximum of +2EV, depending on how bright I want the highlights to appear.
The result is that I can guarantee, without looking at the back of the camera, that my pictures are never over-exposed.
And, as for using the waveform in post processing, why would you need to do that when all it offers is to show you where over-exposure is in the image? Surely, that kind of thing is obvious without cluttering up the screen with even more “stuff”?
< tinhatmode >
That is because it is a primarily a crutch for lazy photographers who can’t even see what part of an image is too bright when taking the shot.
< /tinhatmode >
Simply because immersing a memory card in developer, stop bath and fixer doesn’t tend to do it much good
But, please note the < tinhatmode > markers around that comment
I’m sorry if my comment might annoy some but I was taught photography from the age of 11 and discovered large format photography at the age of 50. It was the latter that taught me how to make photographs instead of just taking them, having to learn how to expose for film that only had 5 stops (or less) dynamic range. And, if you got it wrong, it wouldn’t be until your got home or took the film to a lab, that you would discover if you got it right. Filters were (and still are) things that you put in front of the lens to balance the light on a scene - failure to use the right density or colour would result in the waste of at least €5 for the sheet of film, plus the cost of processing.
Yes, I know we now have these super whizzy, snazzy digital cameras but so many people assume that the computer built in to them knows what it is doing and end up having to rescue images in post processing.
The main reason I use a RAW editor is to do the same with a digital file as I would have done for a sheet of B&W negative film. For the film I would expose for the shadows, measure the dynamic range and calculate by how much I would need to over-expose and under-develop in order to get 14 stops range out of the neg onto paper that has only 6-8 stops range. With digital, I expose for the highlights and use the RAW editor to recover the shadows. The result is the same.
Also, in my case, the procedure is the same - get the exposure right in the camera and minimise any work required after the fact. I have taken shots that need absolutely no post processing - not boasting, just jumping with joy when it happens
I searched in Affinity Photo, found it after a while, checked with different pics to get an idea about – but not much ‘success’. All I understood was, the horizontal axis shows what ( = where in the pic) we are talking about and the vertical axis shows the value(s), either the luminance or the colour levels (there are two representations in AP). If I may guess / imagine, it’s ‘easier’ to follow a moving subject along the timeline, while the then relativ static background appears with somewhat constant values. But no idea really – I’m NO videographer (and yes, I watched the video).
Now – to check for likely difficult areas in a photo, I activate the Shadow and Highlight clipping and just move the exposure slider back and forth (or the Tone curve …) and see what information is there, I might want to recover …
With that said I wonder, if a Waveform presentation would save me the ‘effort’ and allow me to evaluate the ‘critical’ parts w/o manual intervention.
A well enough exposed pic ‘helps’ – no question about, but that’s not the topic.
Gee, @Joanna you remind me of a car mechanic who learnt to diagnose engines the way he was taught 50 years ago. You really think, “spot measure the highlights and give them 2 stops more” is proper exposure? Dream on.
I got curious now how waveforms look like in Affinity and I think they show much more than the pretty coarse histogram which never evolved to something useful. If displayed to review pictures in camera, it’s only showing the JPG preview.
And that is the reason why all RAW converters are cluttering a histogram somewhere? Your plead for getting exposure right from the beginning is working nicely. As long as you have time to measure a subject before you press the button. I’ve seen a lot of landscape or still life subjects in your sample pictures. Nothing against that, landscape and rocks are not exactly urgent subjects. So, there’s enough time for all kind of exposure evaluations. And sometimes there’s not. Therefore I’m happy to know how my camera’s measuring when it has to be snappy. Like in snapshot. Like in action shots, in available lights, at night, no tripod or large format film (so expensive and so super limited to static subjects) involved.
Back to the subject. Like @MikeR said, it’s intuitive. And that will be the reason it won’t be implemented at the end. Too modern for people who don’t look at a histogram (like myself).
It definitely takes a while to get used to the waveform. But again, once you do you’d wonder why you ever thought a histogram was enough.
I agree it probably helps to see how waveforms work with a moving picture to get a sense of what’s going on. But again once you understand it they become pretty easy to “read”
And of course getting exposure right in camera is great. And having a calibrated monitor I agree is essential. But still I would use a waveform view to adjust mid tones, highlights and shadows (and black level). You really can’t get that right “in camera”.
I shot at an air show today. Planes flying as fast as 700MPH. And many times the planes were backlit (air show was at the beach and the sun was above and behind the planes.). “Exposure right in camera” especially with partly cloudy skies is a pipe dream. These will need some work but I got some great images today. Including an awesome vapor cone around an F-35. (Yep. Shooting 50MP stills at 30FPS. The vapor cone appears only in 7 frames. About 200ms. Also used 1/12,800 shutter speed today to freeze two jets crossing. Cool stuff possible with a modern camera.)
From what I read is that a waveform diagram has on the horizontal ax the columns of the display monitor and on the vertical ax the analogue power output in IRE. It’s dealing with the output device. Clipping is seen on the extremes of the vertical ax.
A ‘normal’ histogram is dealing with the, digitized, analogue input of the sensor. It has on the horizontal ax the possible digital values and on the vertical ax a representation of the amount. Clipping is seen on the extremes of the horizontal ax.
I wonder how a waveform histogram can be useful for printing?
The “output device” in this case is your output JPG or TIFF or whatever.
Really a waveform is just a series of histrograms that have been rotated 90° counter clockwise, where each one is a histogram of a thin vertical slice of your image.
The file isn’t an output device itself. I can’t see it itself but it can become visible on an output device like monitor or printer.
I also see that your image of a waveform doesn’t use the IRE but a 10 bits division.
I can’t see the advantage of a waveform above the histogram.
The video world is 10 bits. That’s why the levels go to 1024.
Anyway for me the biggest benefit is that you can see the histogram for the vertical slices of an image. Using the above as an example, it’s really quit difficult to see what levels make up the white tutu, from the histogram. However, if you take a vertical slice, you can get a much better idea.
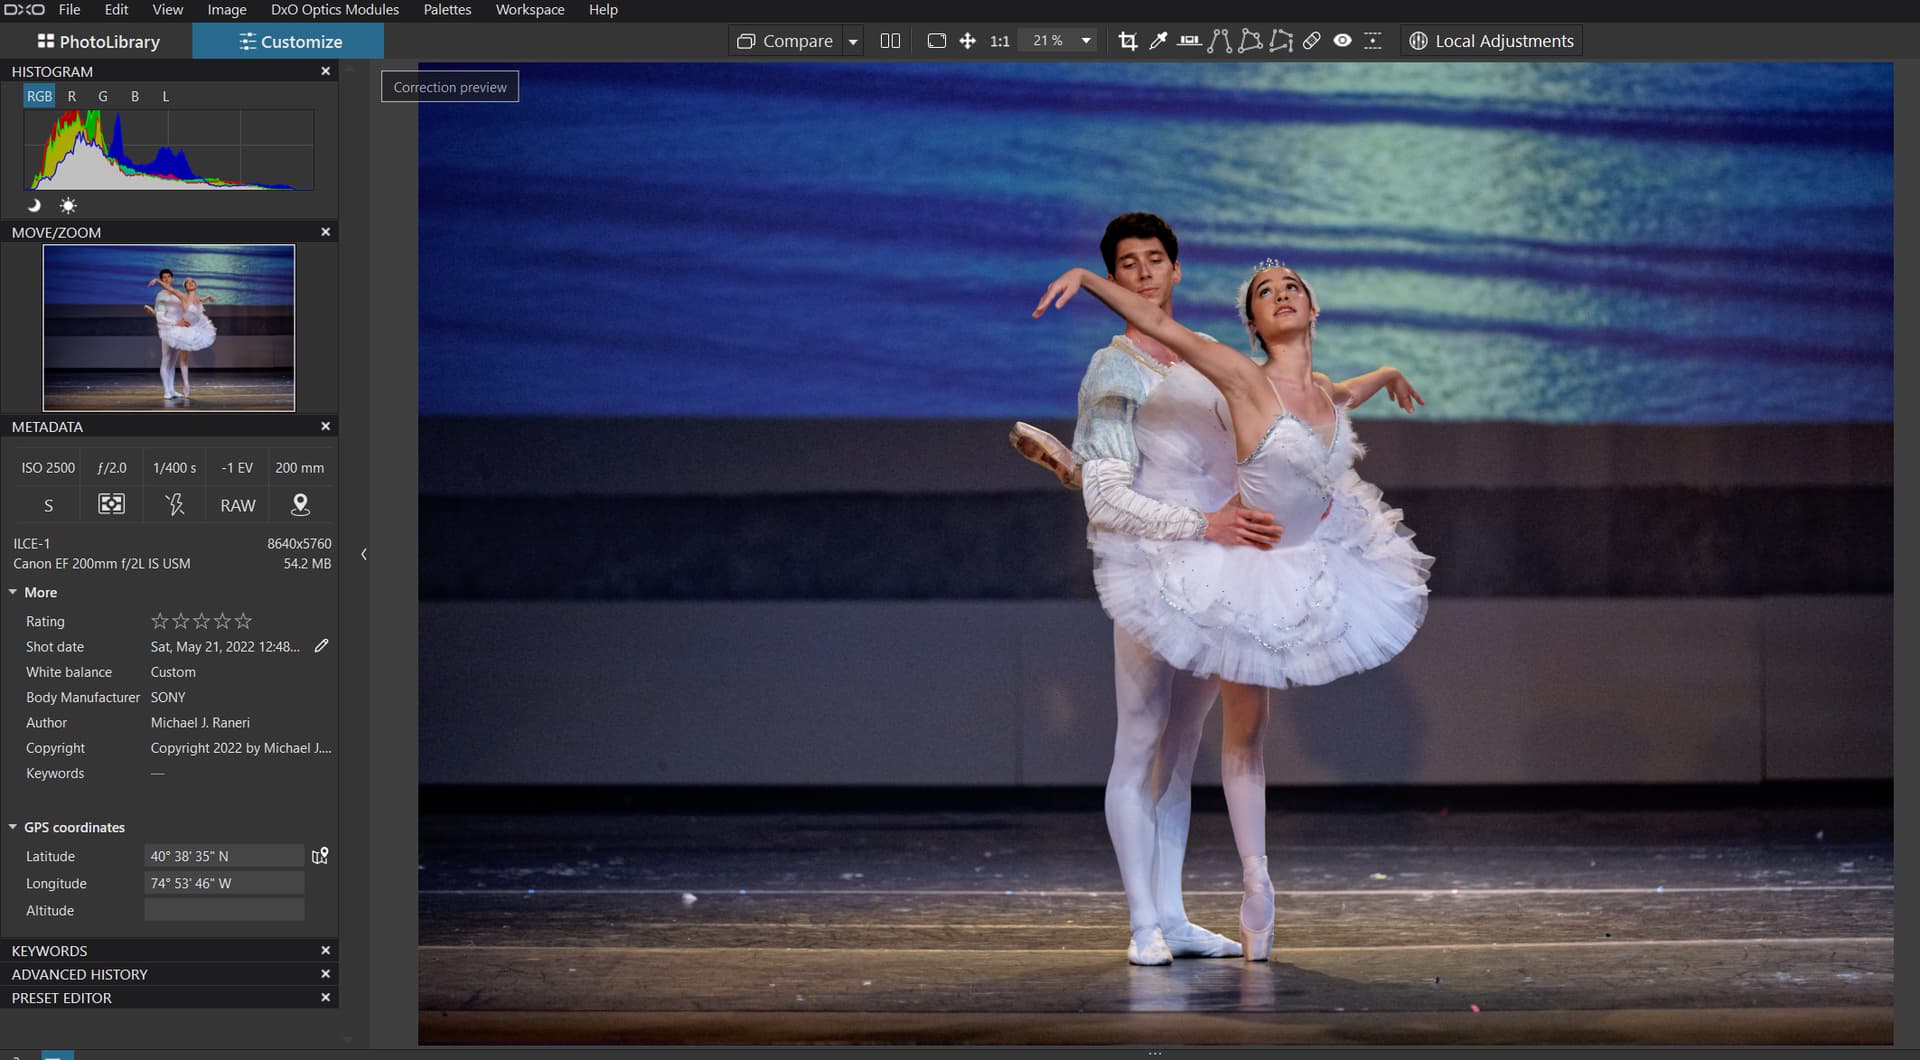
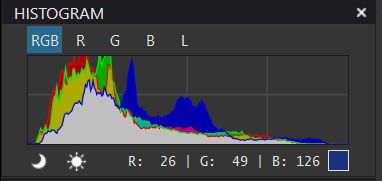
Consider the histogram shown with the original image (which has been cropped)
For me, this second histogram is much more useful. With the waveform, you get all of those vertical slices in the same display. You just look at the shading of the waveform in the right vertical slice.
You can also use a waveform to set white balance. It’s technically possible with a histogram too, but you need a much larger area of the same neutral color.
As I said, if you spent some substantial time using waveforms in a video editor, you likely wouldn’t want to go back.
@George thank you for the link and @MikeR for the follow up – understand better now.
As said, with activated clipping information I check and control the output in post – similar to what I do off and on with the camera, it’s histogram *) yet ‘relying’ on JPEG output.
@George, while this works for the screen, it doesn’t for prints. Paper is a reflective medium with a (much) smaller dynamic range range than display, which also depends on the type of paper.
– That is, when softprofing comes into play. With a suitable monitor and paper profile one can ‘preview’ the outcome, work on the output-file, decide what to correct and also what to sacrify …
I just spoke with my neighbour. He is doing video and photography. He showed me an example where he used the waveform. The case was a video and images taken in a museum. They should be shown together and therefore it was important that the exposure and colours would be the same as possible. The trick was to place the image and a still from the video on one screen and made them each only visible on one half. The histogram would show the total of that screen, mixing the two images since the horizontal ax is just showing the total of the pixelvalues per value. But the waveform shows columns on the horizontal ax. So the left side corresponds with image 1 and the right side with image 2. Now it was possible to change the curves of one and compare them with the other. I hope you will understand what I wrote, I’m not sure
@Wolfgang , printer is just an example in which the content of the jpg etc. becomes visible. The jpg etc. is not visible.
I’ll vote for this feature if Mike updates the request to be,“choose between Histogram / Waveform / Vectorscope” as the latter is helpful when setting white balance, e.g. see here:
")