Processing performance in DXO on RTX 5060 and RTX 5060 TI cards

Good to hear. In my case errors happen randomly at about 1% rate and they are NOT related to particular images. DopCor process crashes and gets restarted by PhotoLab, with two (= #export threads) errors reported per crash. Nothing in OS stats or in nvidia-smi logs to correlate with, so much deeper analysis is required by DxO. Currently I don’t have time to use diagnostic tools as described on nvidia site, e.g. How to capture D3D debug layer logs to detect application or runtime bugs | NVIDIA , How to use Microsoft's WinDbg to troubleshoot application / system crashes | NVIDIA .

EDIT: Another problem, the one with leakage in ‘Shared GPU memory’ for Non-NR images exported in a large batch, looks partially reproducible and suggests there might be actually two root causes for that, maybe in Microsoft’s code this time.

@Wlodek I was getting frustrated that I couldn’t reproduce the problem with my images but lucky that I re-discovered the Fuji images and had created two directories when I downloaded them, one for non-AI images, to specifically test XD3, and another with AI on some of the images to test AI with or without DP3, XD2s(XD) and XD3.

I didn’t do the follow up tests with the AI directory but did with the non-AI directory and it remains reproducible on the 5060Ti(16GB) and I will test it on the 3060(12GB) which I successfully upgraded to 581.80.

Here is the first failure with “NO NR” on the 5600G with the 3060(12GB)

At the same image as the first failure on the 5900X with 5060Ti(16GB) so PL9.2 is failing on ttwo different machines at the same point and they are on slightly different Nvidia drivers.

Coming back to my trials in post #10 (with NVidia RTX 4070) …

.
PL8.10

.
PL9.2

I deleted two more files (no idea why they weren’t included in the batch export), did other things, and also deleted the database (which didn’t help initially). I really don’t know what the problem is (and didn’t use AI masking, which would have significantly increased the timeframe).

Usually I don’t export in batches, but work with individual files. Therefore, I’m leaving it as it is for now (quite annoyed).


note
The two images I just deleted (just like the other two before) can be exported as individual images … which means that there are (actually) no problems with them, such as ambiguities regarding the lens profile or …

@Wolfgang I have a reproducible error so I will submit a support request, because I don’t have a premium subscription it will be interesting to see how long it takes to get a response! If they then suggest I reproduce the problem with a logging option set then I can do that and hopefully it will point to what is going wrong.

At a guess it is caused by the number of images in the batch which are then causing the software to trip itself up, e.g. using resources, adding to arrays etc. etc. .

So when I remove images from one point in the selection the problem moves down the selection and that repeats itself every time I leave “problem” images out of the selection. It would have vanished completely if I de-selected sufficient images that the “error(s)” were not then encountered.

Whether another export would have cleared the problem or simply encountered the problem even sooner. Terminating the export worker should prevent that kind on knock on effect (if it exists).

A bit like this

Two runs of the same export selection that stopped at the point where the earlier test first failed with the second run scheduled before the first had finished.

The first export run was fine and the next failed on the first image, exactly the same point it would have failed with the original test selection.

Between the two pairs of runs there was a gap while I wrote part of this and it seems that the breathing space was sufficient for the software not to fail again during run 3 .

1 Like
Name of the application causing the error: DxO.PhotoLab.ProcessingCore.exe, version: 9.2.20390.524, timestamp: 0x90223ee5
Name of the module causing the error: DirectML.dll, version: 1.15.4.0, timestamp: 0x671c4ecf
Exception code: 0xc0000409
Error offset: 0x000000000031809d
Faulting process ID: 0x2E04
Start time of the application causing the error: 0x1DC528A8616D174
Faulting application path: C:\Program Files\DxO\DxO PhotoLab 9\DxO.PhotoLab.ProcessingCore.exe
Faulting module path: C:\Program Files\DxO\DxO PhotoLab 9\DirectML.dll
Report ID: 72ee8095-039a-4683-bb70-cc10d45ad0db
Faulting full package name: 
Faulting relative application ID for package:  

I managed to process the photo in single mode on the third attempt. In the meantime, the PL crashed and system errors appeared (lost handlers). I restarted Windows 11.
The bugs may not be blocking in the strict sense, but they are critical. Sometimes the PL9.2 application crashes. Sometimes you have to reload the system. The usefulness of such an application is questionable in a situation where time and reliability are important, because we are processing photos from an event and there are hundreds of photos that someone is waiting for. Ultimately, my own social media are waiting for them. Imagine I’m tired after a long day, it’s midnight, and I can’t finish my work because PL keeps crashing. In such a situation, I will probably reach for the previous version.
We don’t know for sure if DXO will fix these bugs. I’m afraid that the Black Friday promotion window will close in about 4 weeks. It will be difficult to make the decision to ‘take a chance’.
The AI features are spectacular, but apart from testing and experimenting, the priority is stable operation – application as a workhorse that works-works.

@Adam So far DxO appear to have “blamed” Nvidia drivers for the failures, and that may well be true for AI or even “old fashioned” NR, albeit XD3 for X-Trans is new to PL9.

However, no-one if to blame for the errors found when exporting X-Trans images with NO AI and NO NR except the DxO PhotoLab export code. There is no evidence of heavy GPU usage at all but the export process still fell over after 21 successful exports!?

There will be no second trial period. Even if DXO releases a fix in a month or two, from my point of view, it would be too risky to pay for an annual licence only to find out later that this great fix unfortunately did not eliminate the error in my case. So, the scenario is that for the first time in many years, I will not purchase an upgrade in 2025 and will stick with the (still supported) PL8 version.
The only chance is for the fix to be released within 2-3 weeks at most, so that there is still time left from the current 30-day trial to confirm the effectiveness of the fix in your environment. I would be completely dissatisfied with the fact that NVidia is to blame, and I am paying for a licence for software that is free of errors on the PL side. But effectively does not work :slight_smile:

2 Likes

checked that now (RTX 4070 12GB / PCIe 3.0 x16 motherboard)

( no comment )

That’s what I am thinking, V9 is unworkable on my system which works flawlessly with Capture One, ON1 PhotoRaw 2026 etc.
This will be the first time I haven’t had the latest version, but V9 launched on 2nd September and is still unusable.
Perhaps if they discount V9 enough in their Black Friday promotion they will get sales, but that doesn’t help those who have already purchased. :pensive:

1 Like

On the other hand, the day before the BF promotion ends, we will be frantically wondering whether to buy now, because we can assume that in a week, a month or two, DxO will release an improved version that is worth the price. And buying during the promotion will serve its purpose…

1 Like

@Wolfgang I am sorry but when I saw your post I downloaded the image and DOP and started a test and then I realized they were my image and DOP, time to hang up my coding pad and retire!!

But then on the 3060(12GB)(581.80) this happened with PL9.2.0, my original tests were done on the 5060Ti(16GB)(581.57)

and returning to the 5060Ti(16GB) it also went wrong(!?)

Any idea what is going on!?

With the same set, RTX4070 12GB/581.57, Win11 24H2, i7-14700KF, ZD790 UD AX mb., 32GB RAM, 2 threads/export.
Results, 40x32mpx raws, export time as reported by PL in seconds:

         NoNR   DP3   XD2s
-------  ----   ---   ----
PL 8.10    43    44    124
PL 9.2     50    53    120

First run of XD2s on 9.2 lasted 123 sec but reported 2 errors, i.e. one DopCor crash with a dump created.

In my Z8 test I had very similar results for 8.10 and 9.2, but with this set they are quite different for non-XD2s.

Hard to draw conclusions, other than the processing time depends much on input.

EDIT: Repeated the same test (with 40 VCs of ‘00 - nikon_d850_04.nef’).

          NoNR   DP3   XD2s
-------   ----   ---   ----
PL 8.10     44    53    123
PL 9.2.1    51    54    118

So this time DP3 results for PL8.10 were worse than in previous run, about equal with PL9.2.1 performance. But NoNR/8.10 result was about the same. Don’t know the reason for this, maybe something with lens ambiguity. The file is a resized D850 raw (exiftool ImageSizeRAW=Medium), so I don’t consider it valid for comparisons.

Well, I didn’t want to bother with technical data → see …, → screenshots …

The point is that PL 8.10 (here: exporting to TIFF) performs significantly more smoothly than PL 9.2 and DxO needs to improve this!

Furthermore, no AI modules were used in this test, which place a considerably heavier load on the available hardware.

Btw, PL 9.2 crashed in this test when I ran TechPowerUp GPU-Z to register temperature and such … had to change to HWiNFO(R) 64 :grimacing:

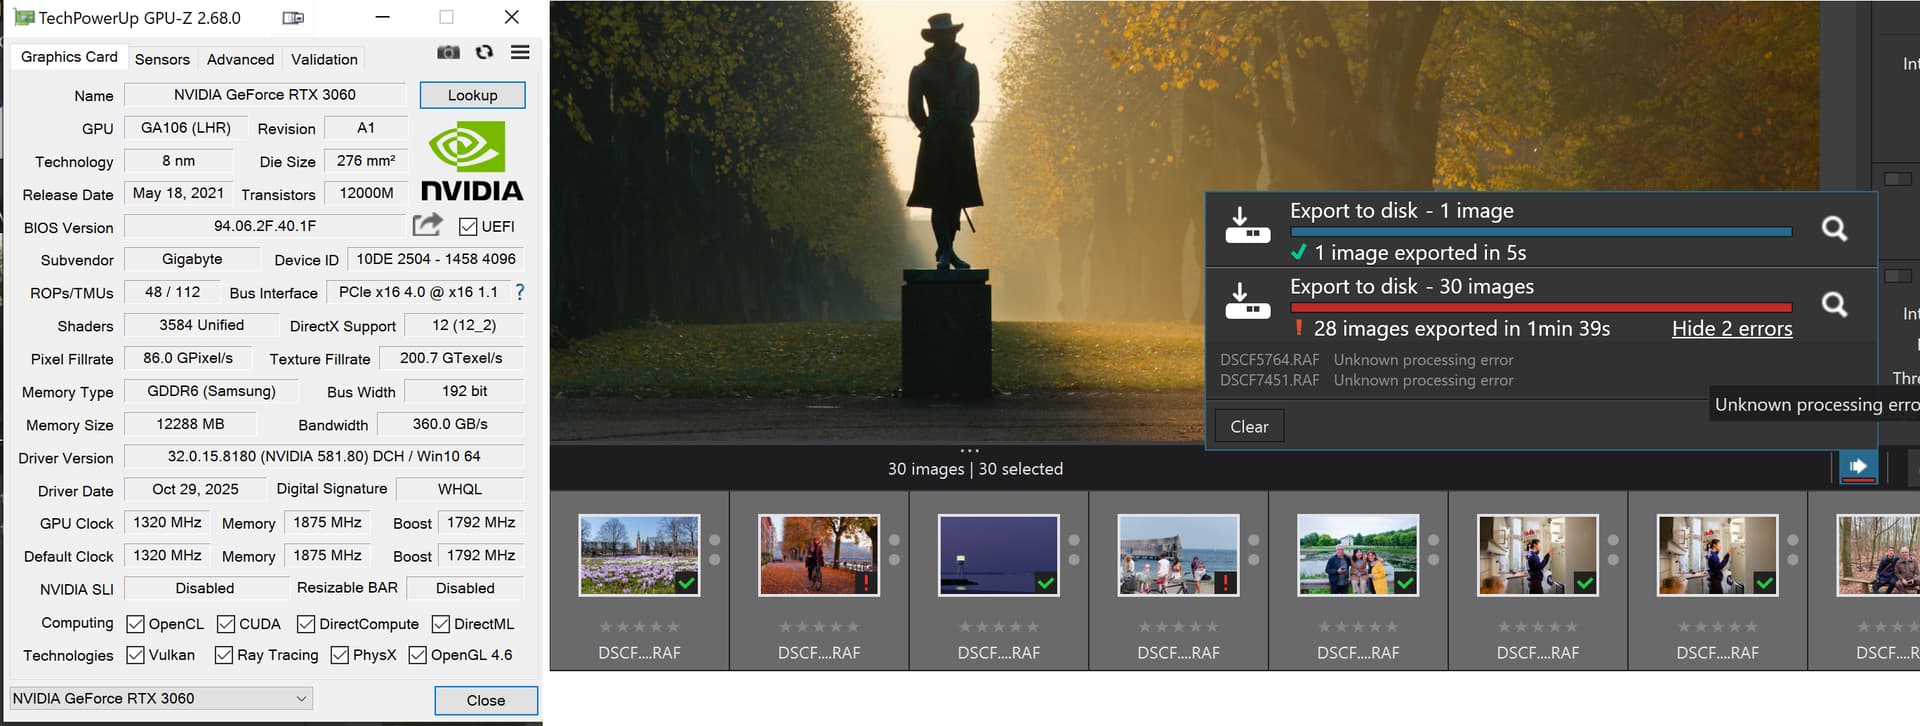
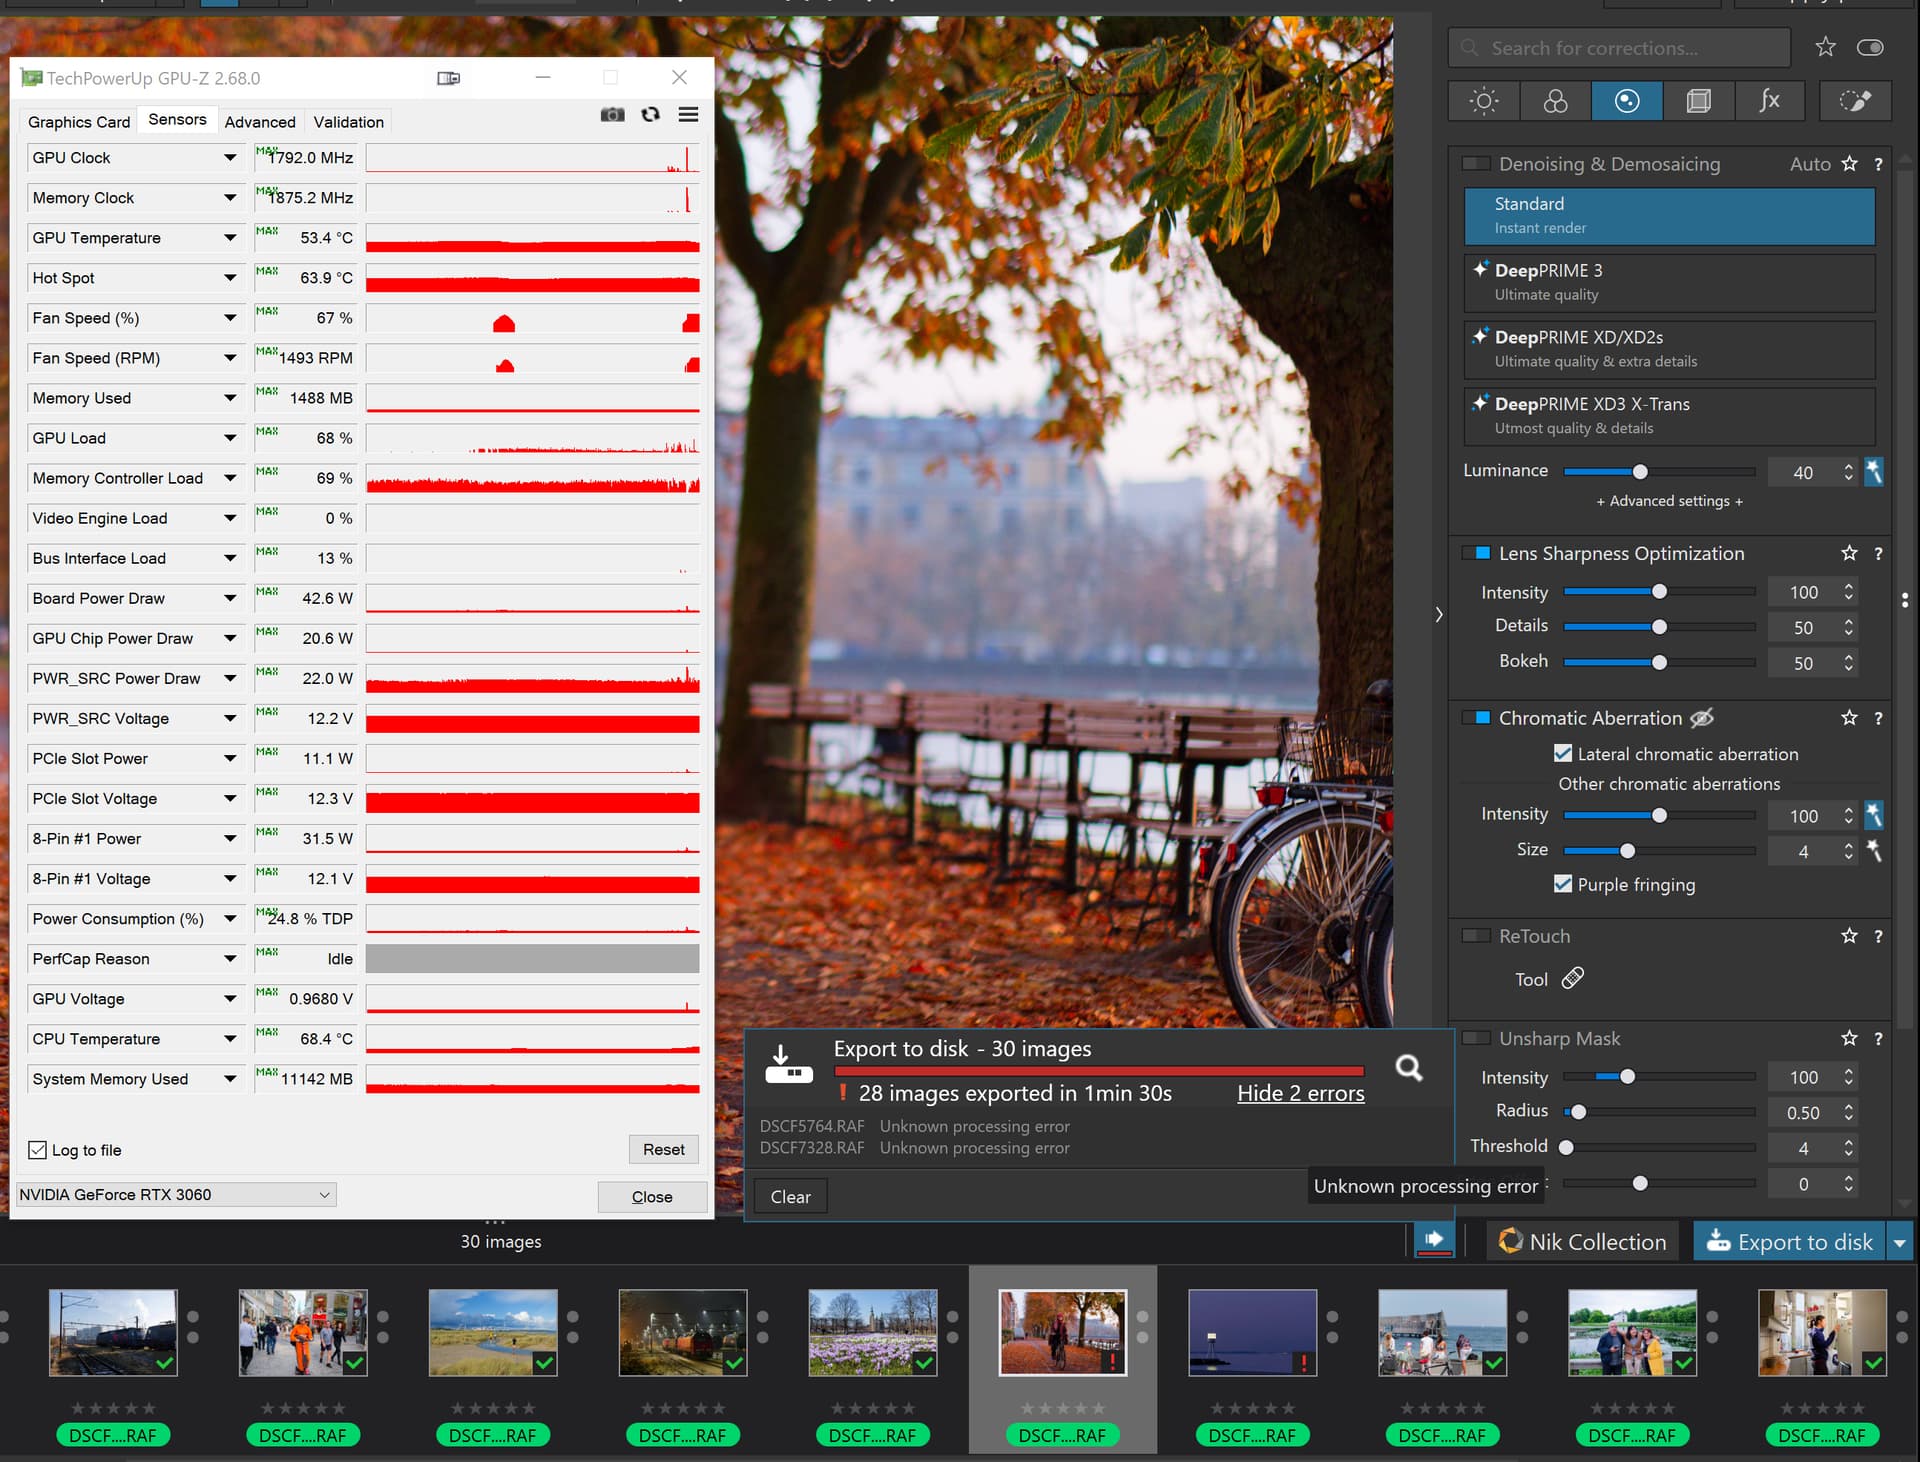
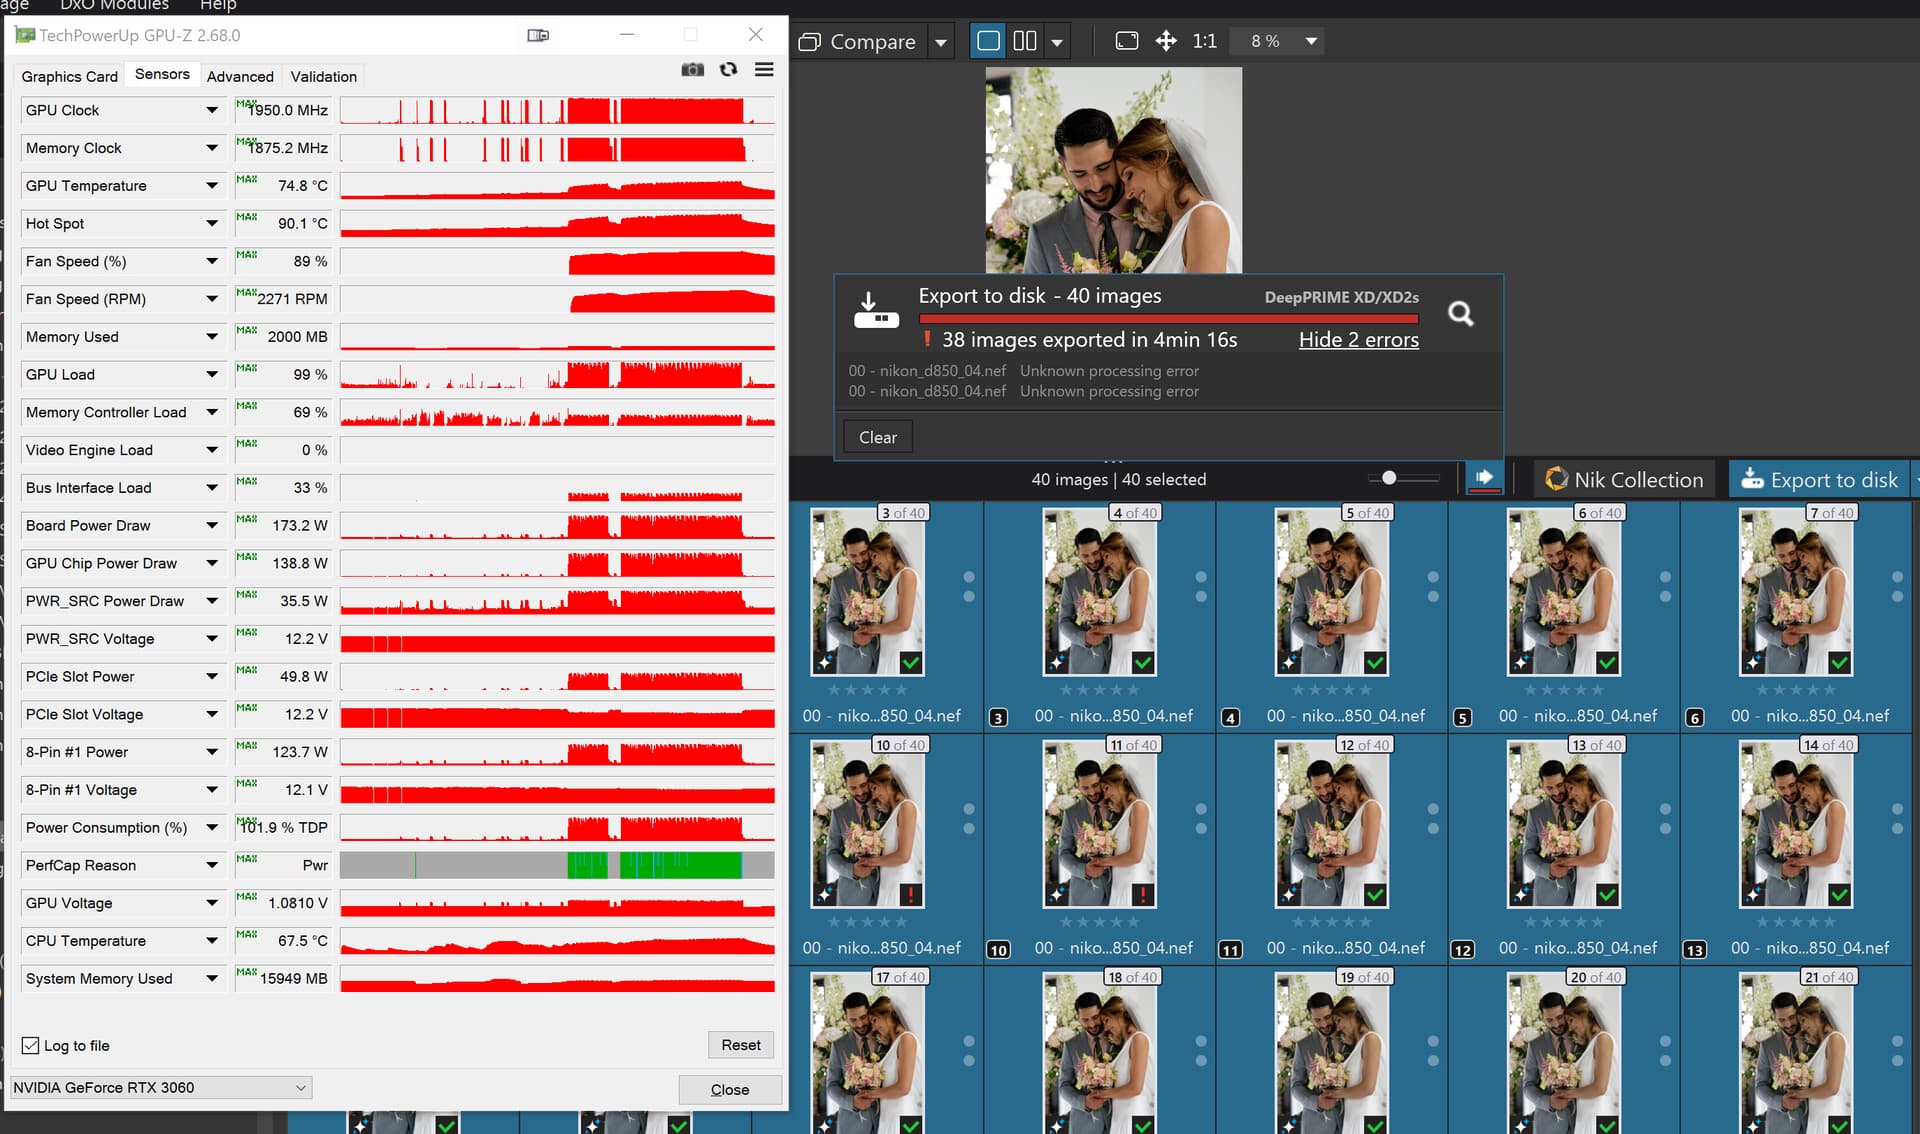
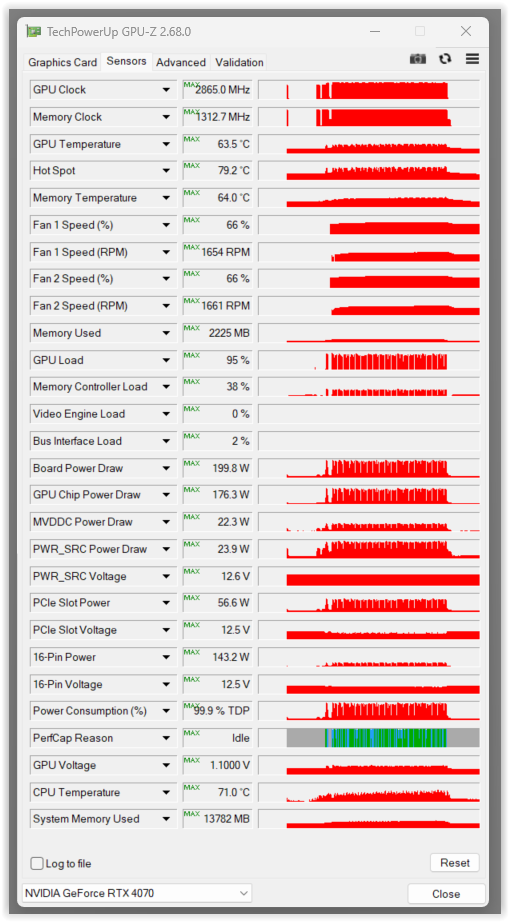
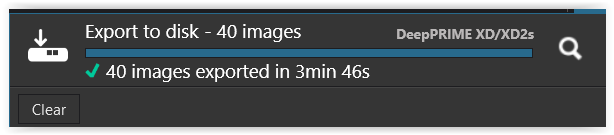
@Wolfgang I don’t believe that GPU-Z running has any impact so we have the results of three runs on the “Wedding” image

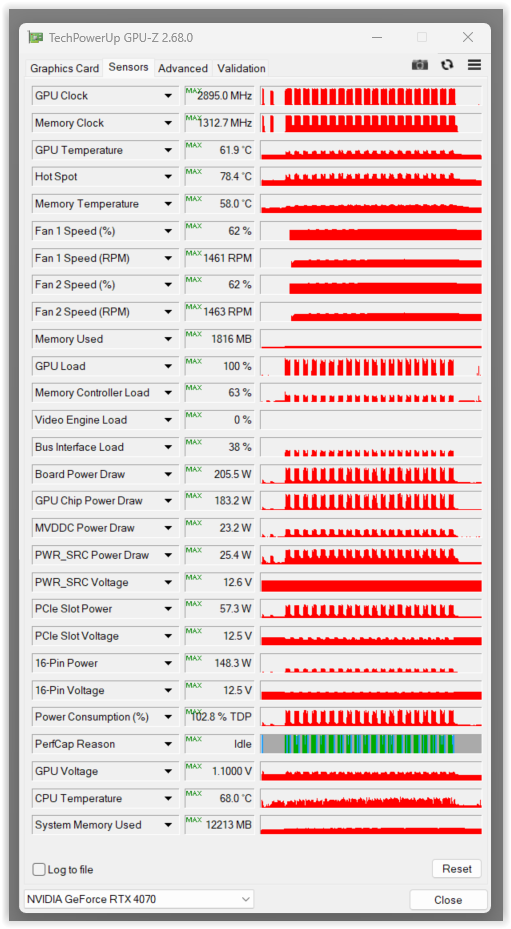
First run is the one I reported earlier, then the machine was in Sleep for many hours, then the second run which started with GPU-Z running, which I quickly terminated, HWinfo was left running throughout that test and no failure.

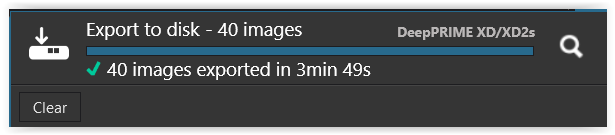
For the last run, HWinfo was terminated and GPU-Z ran throughout the export and no problem was encountered. The same export worker was in use throughout all the runs, but the long sleep would have flushed the VRAM.

The point is that these are non AI images that work under PL8 and PL9, except they don’t work under PL9 sometimes!?

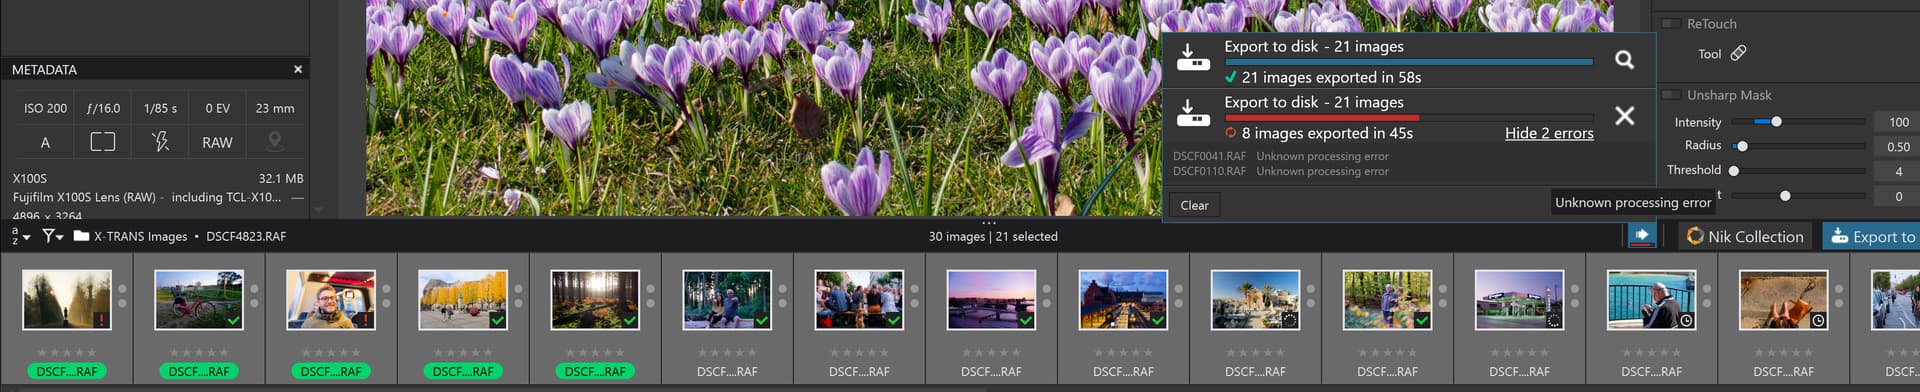
My other tests are completely NO AI and NO NR and the images are a mixed group of X-Trans images. They fail predictably at roughly the same image or, more likely at an image at the same point in the list.

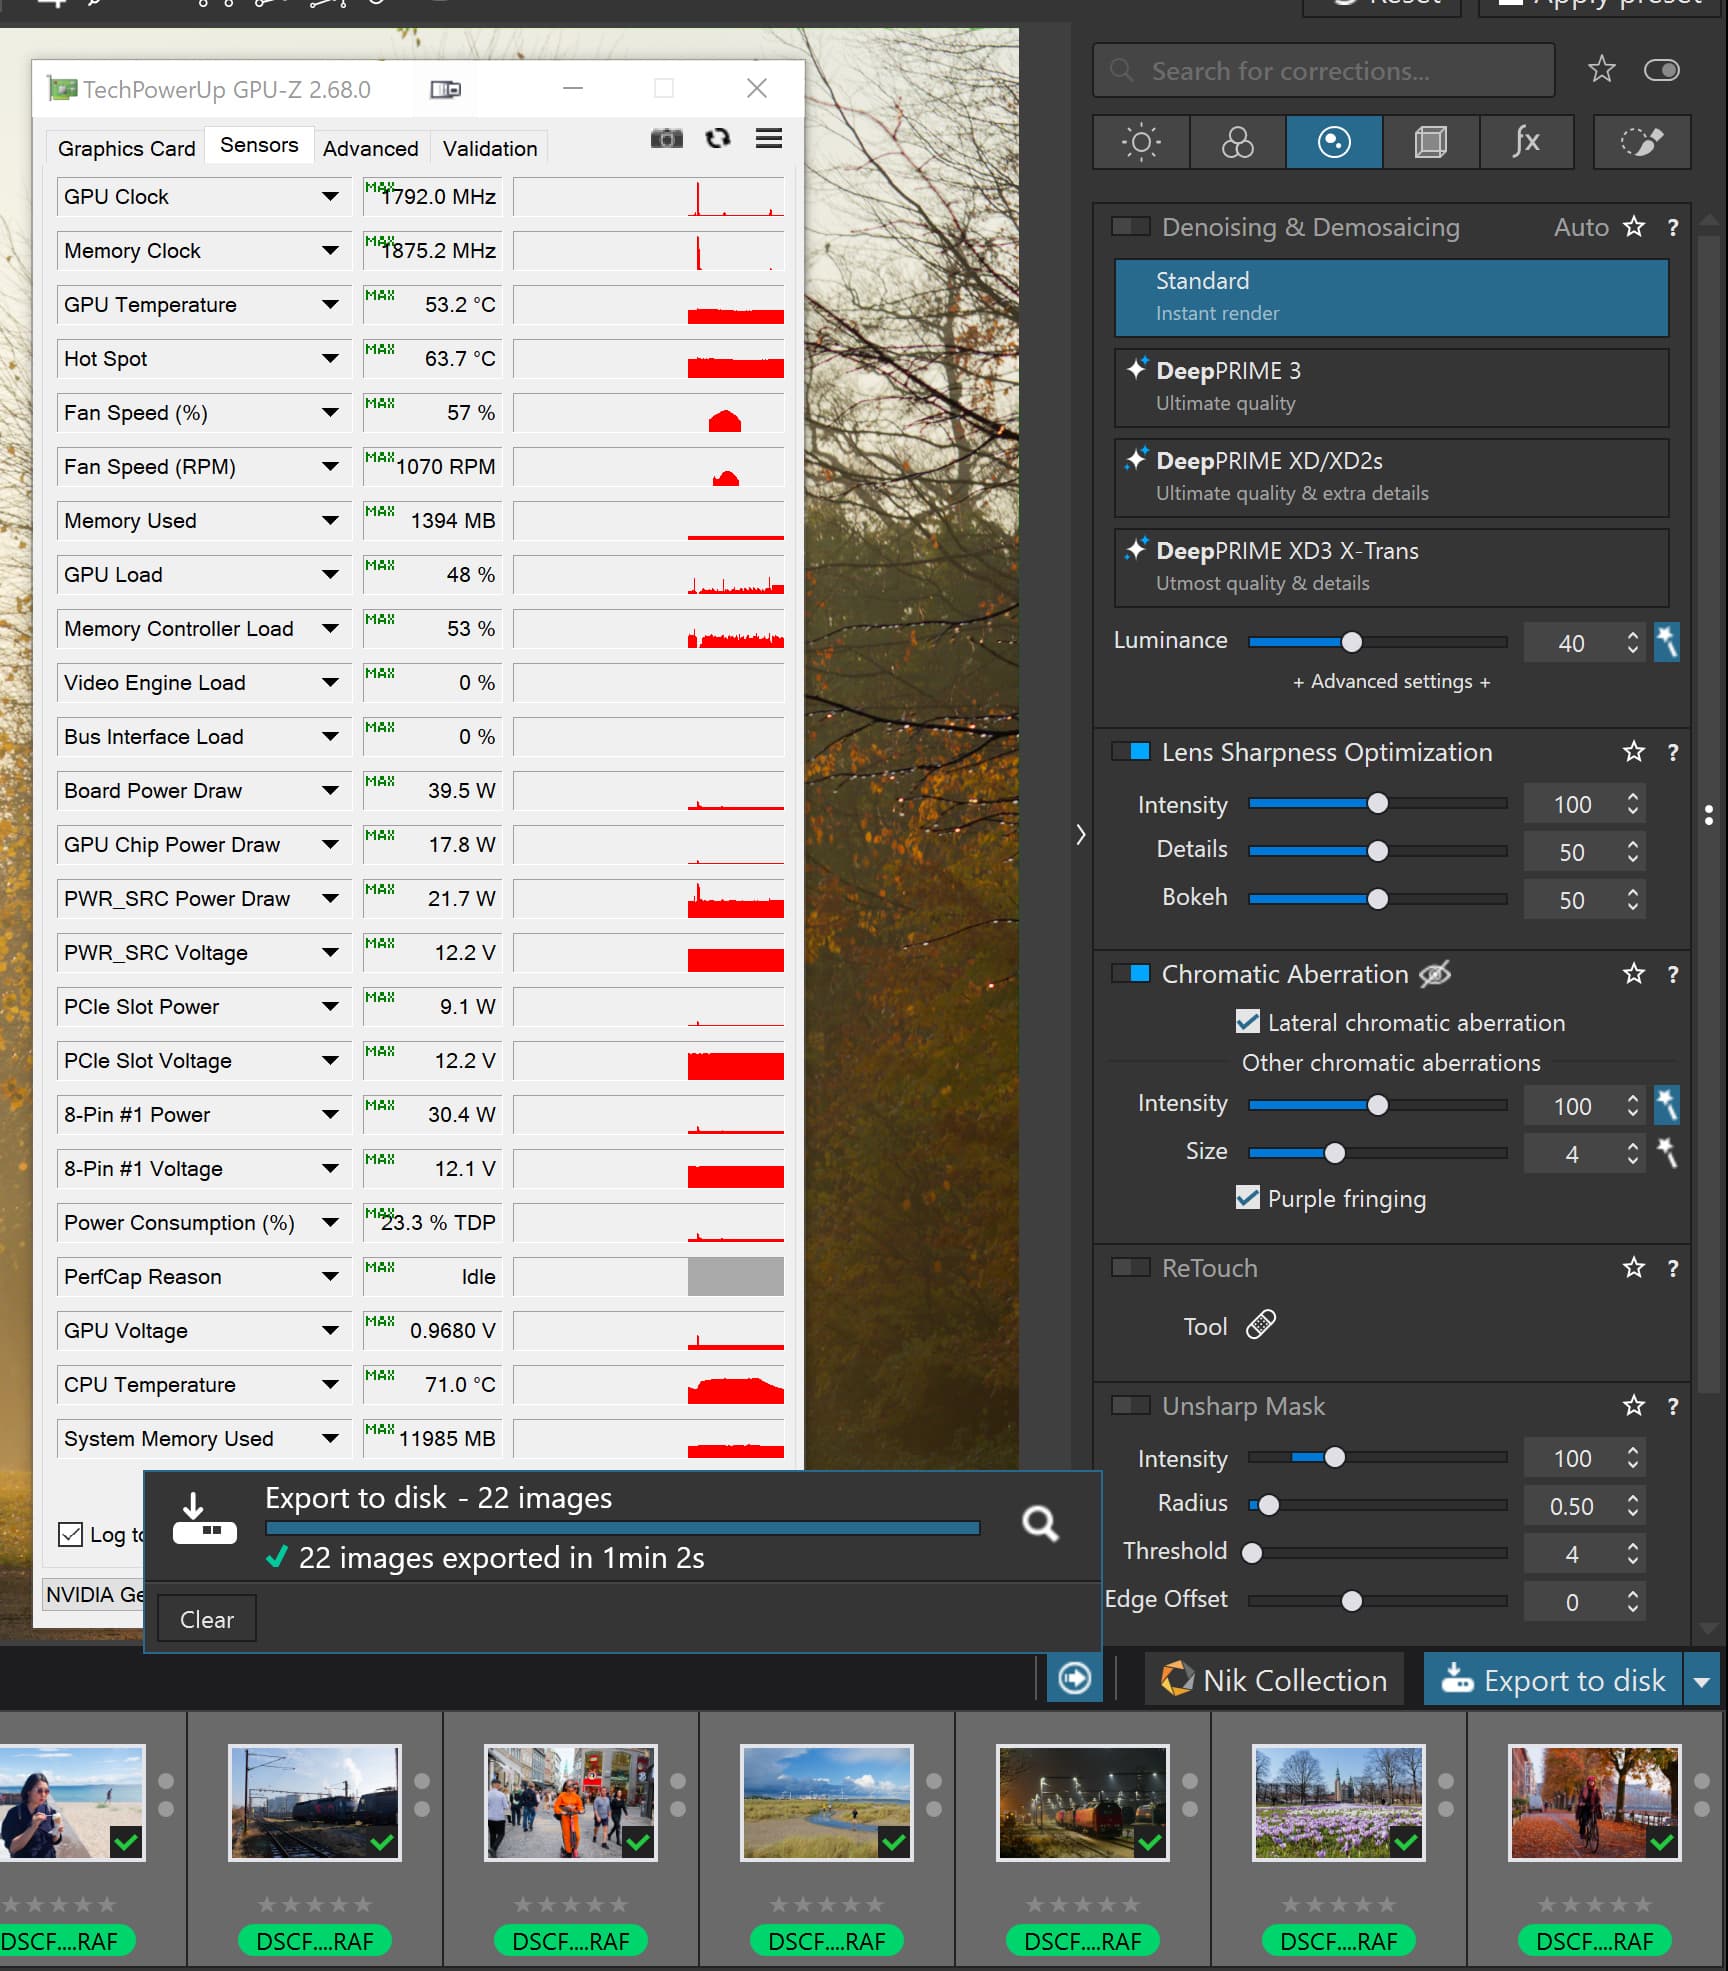
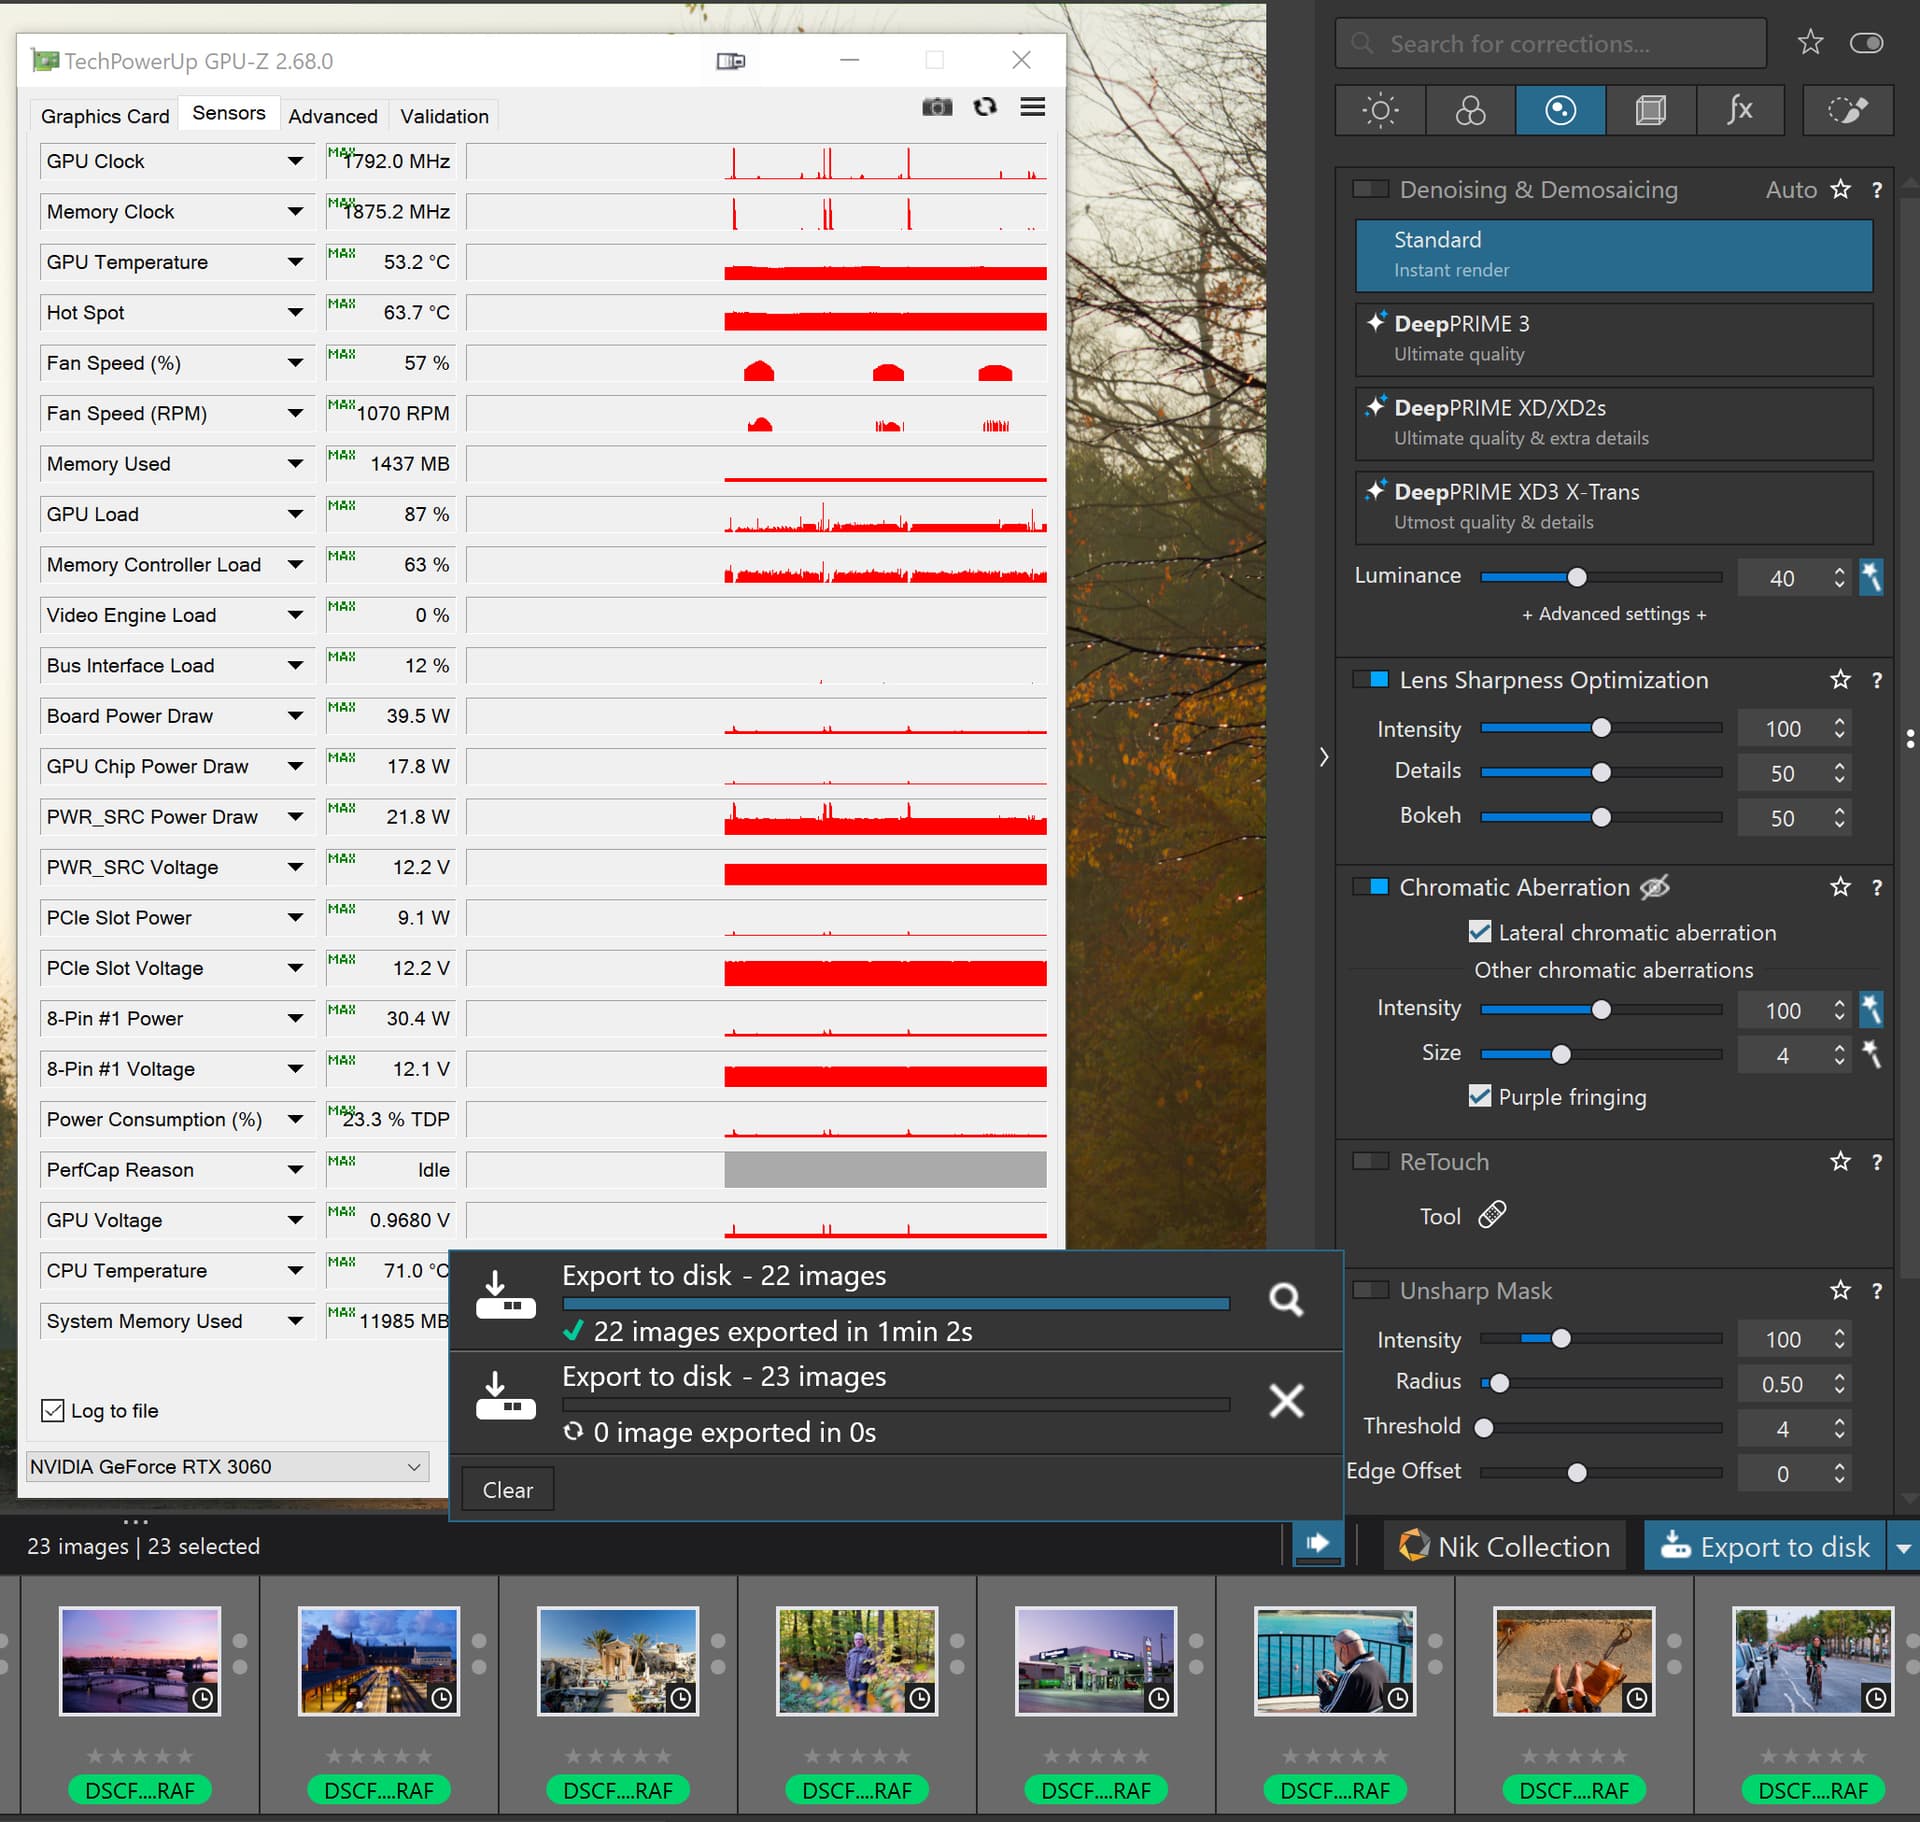
So I repeated the test on those images on the 3060(12GB) with a number of changes

  1. The list of images was reduced from 30 to 22 which included but stopped at the failing image and tested
  2. Another image was added to create 23 images and tested
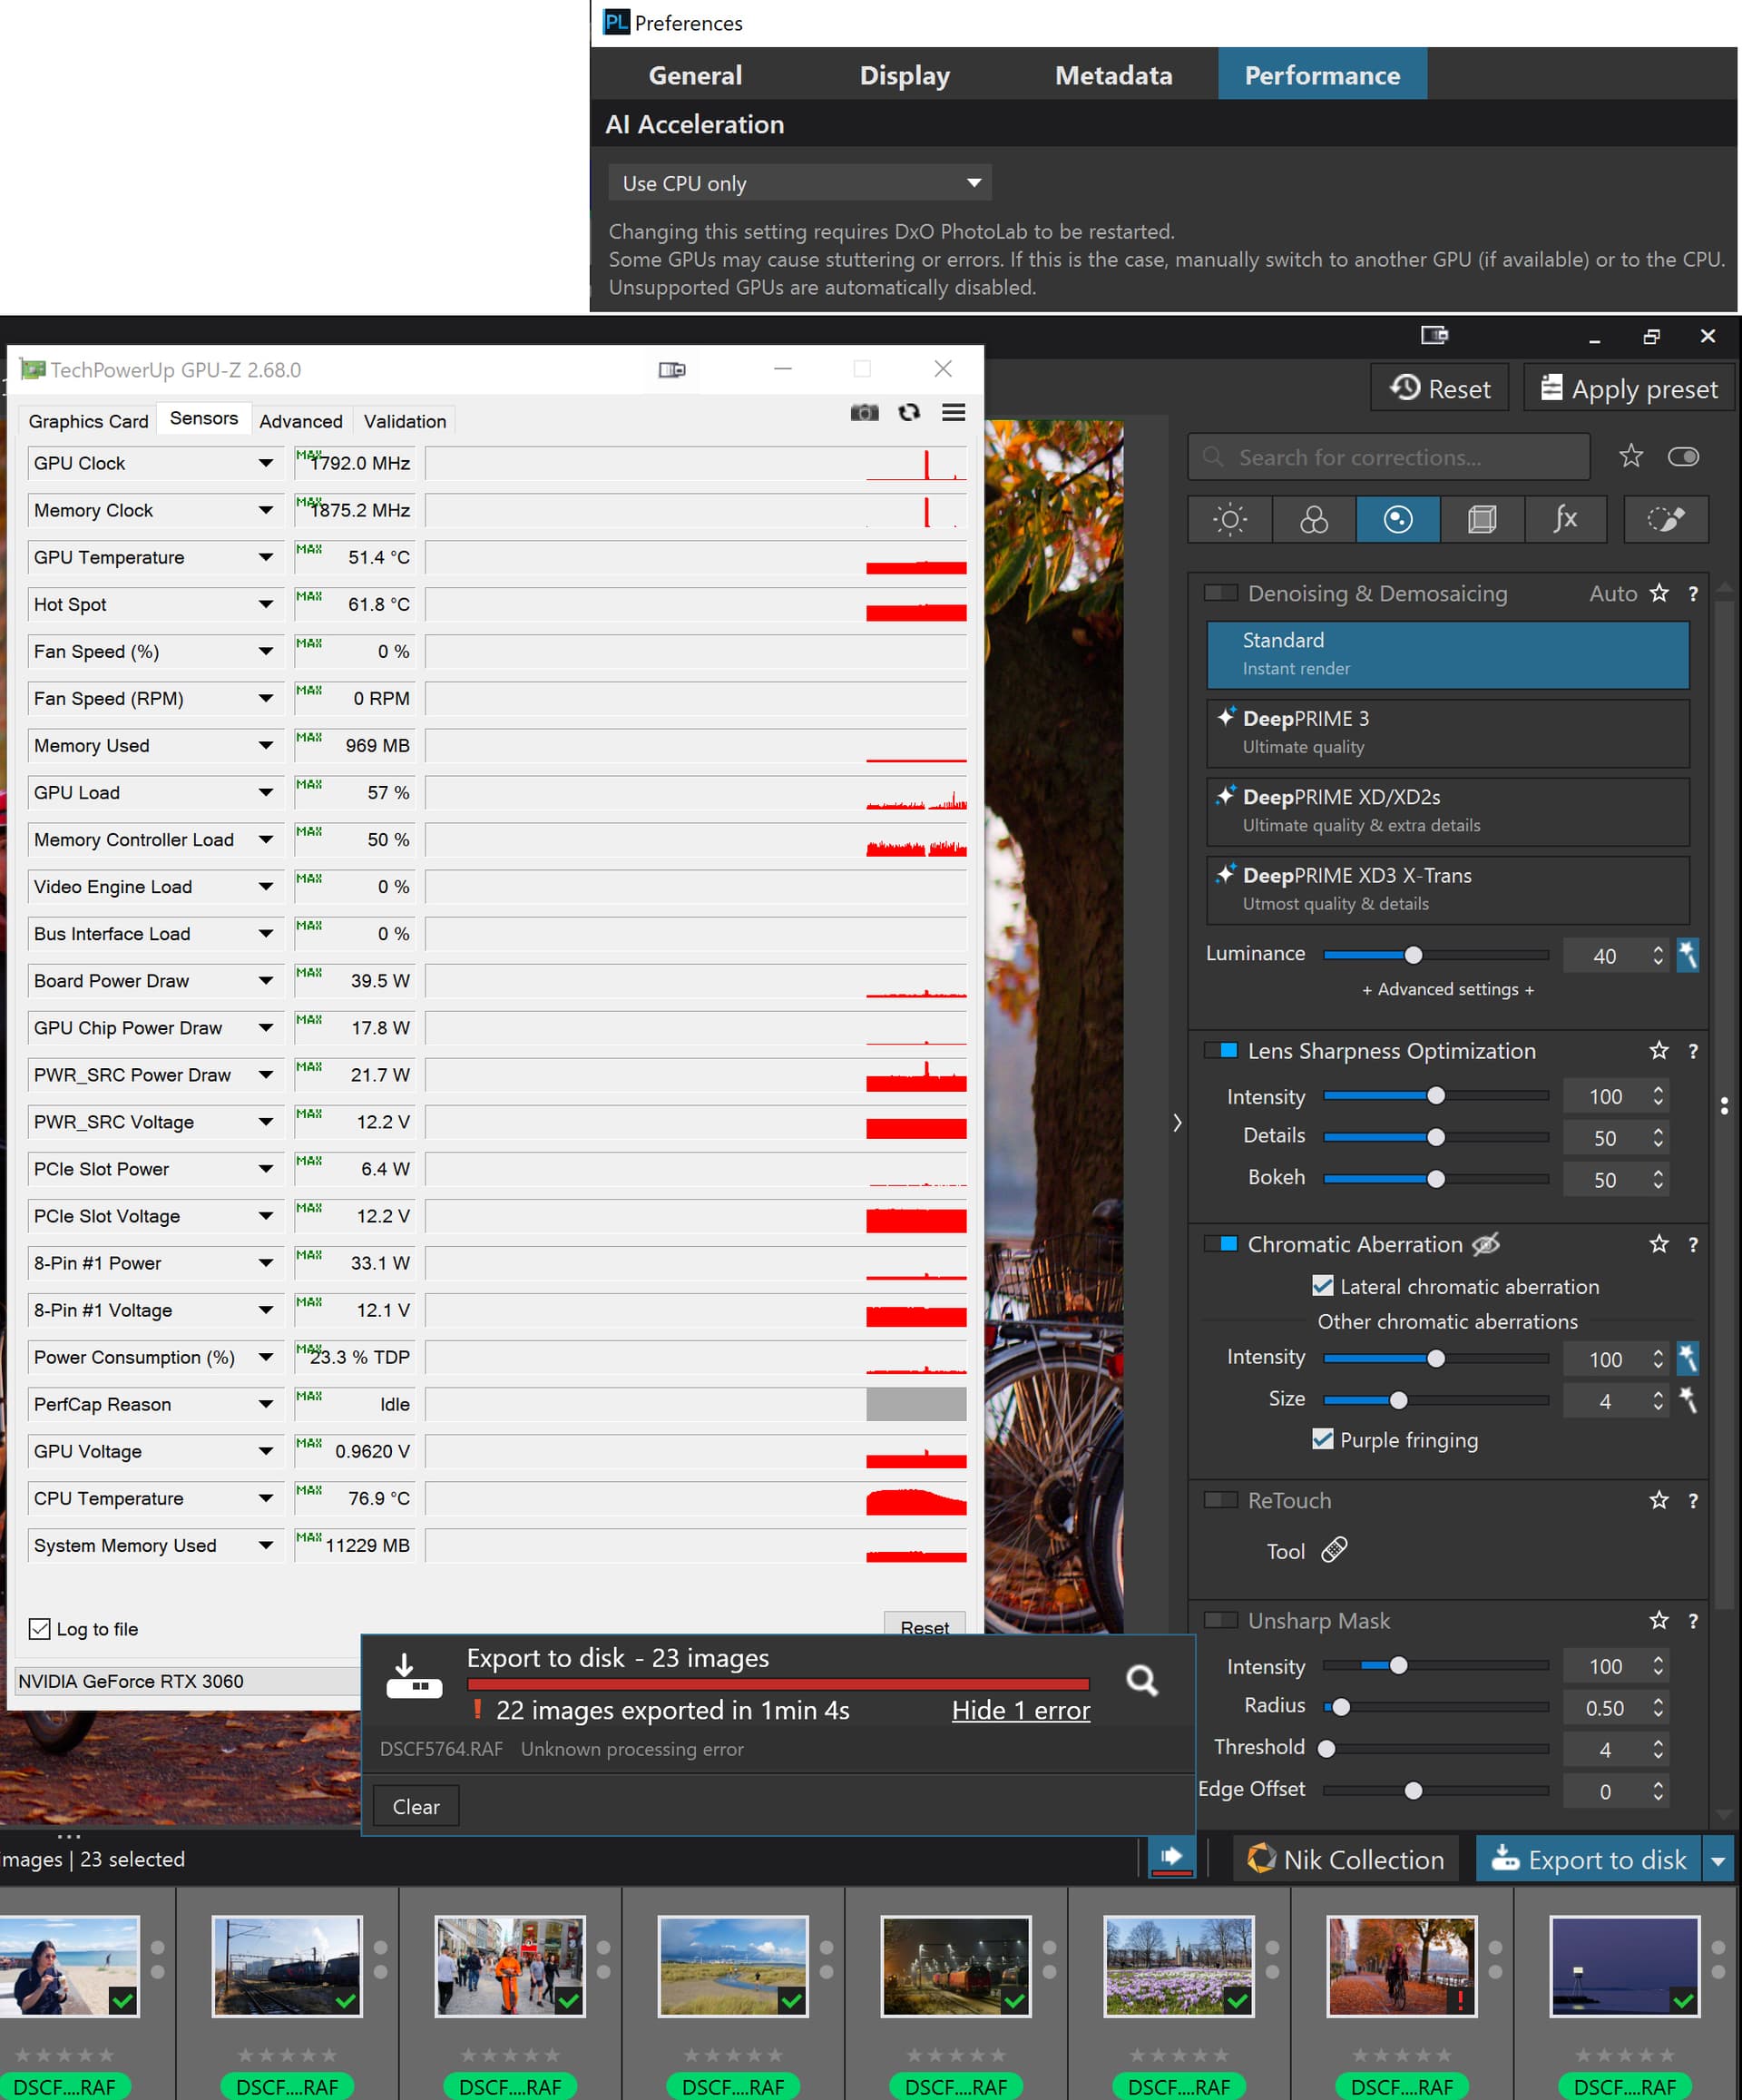
  3. I repeated step 2 but with ‘CPU only’ selected and PL9.2 restarted

These test were on the 3060(12GB)

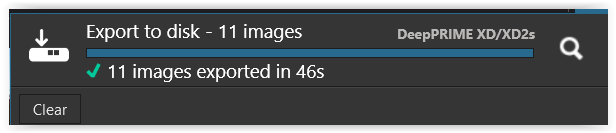
With 22 images in the List :-

It worked and no longer failed on the same image!?

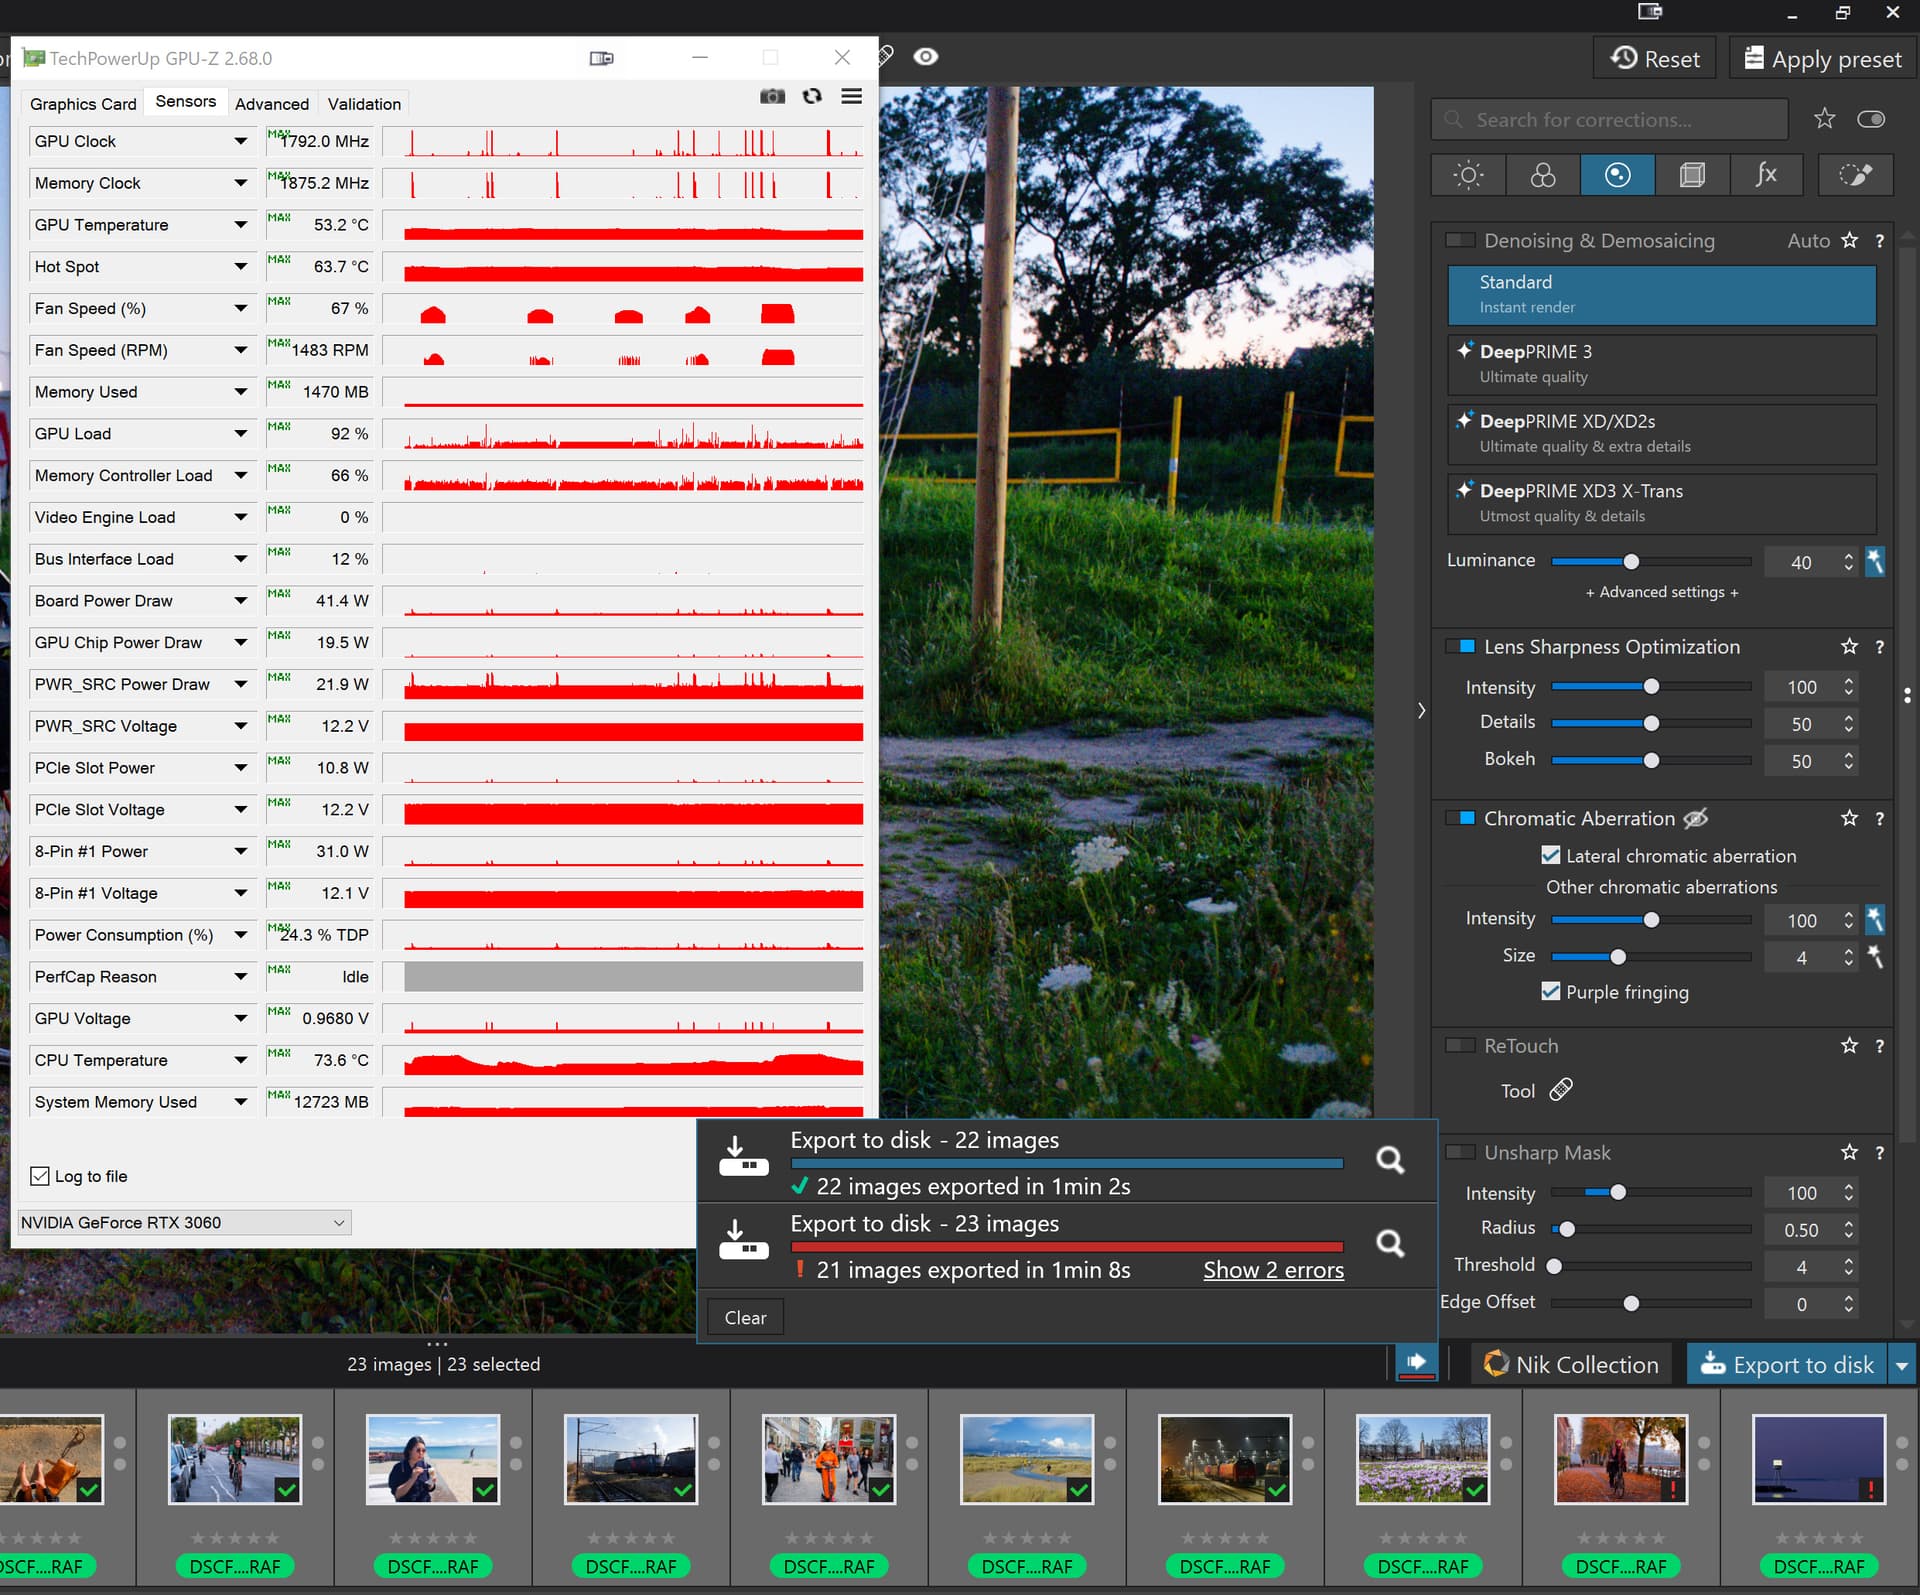
So I dragged and dropped the 23rd image from the old directory to the new one and

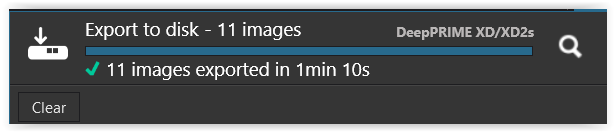
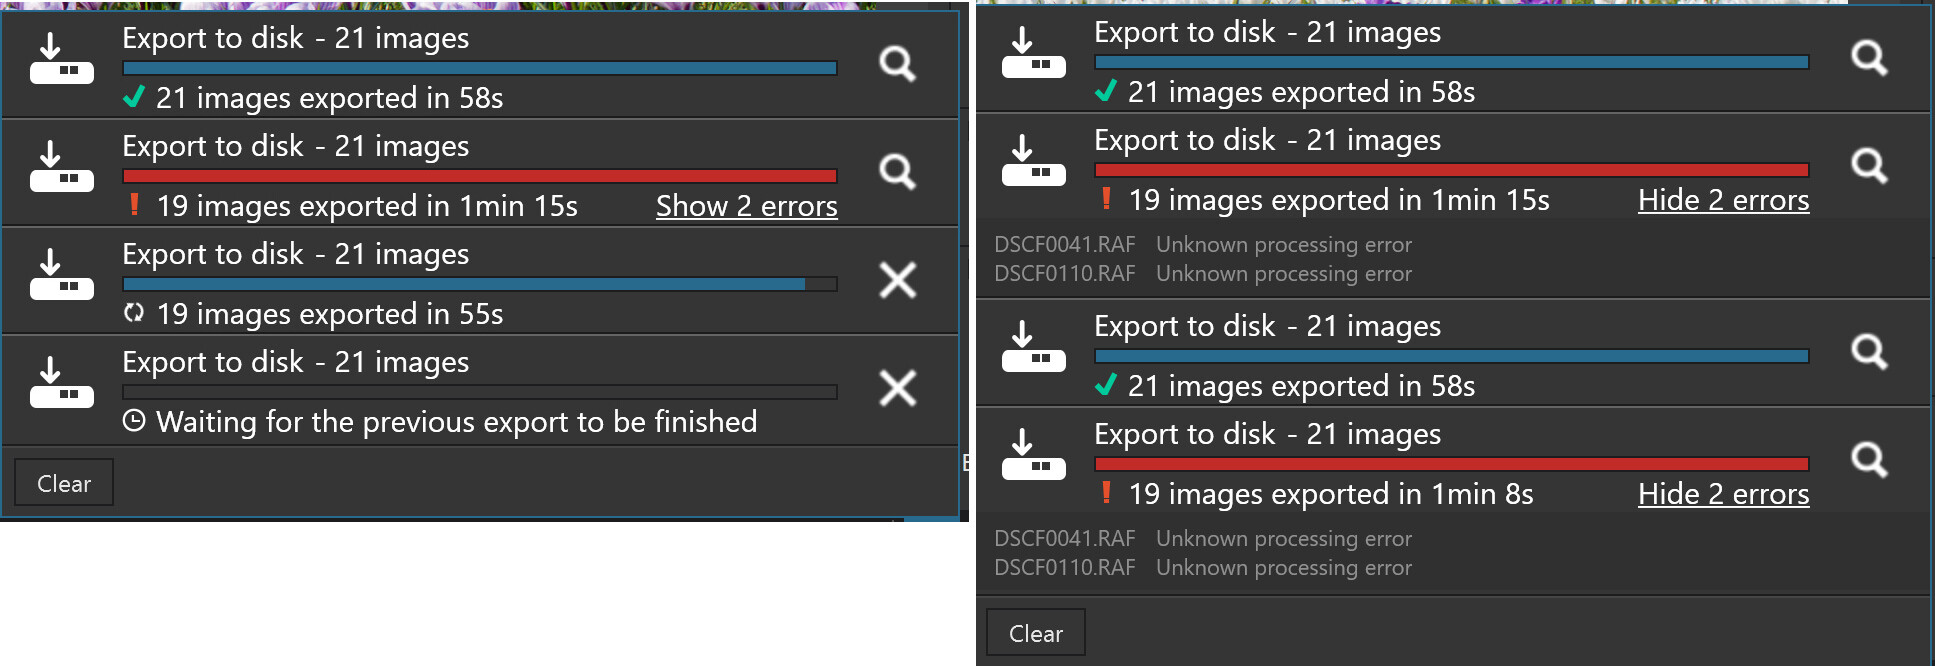
With 23 images PL9.02 “spun its wheels” on the first image:-

Firstly, the first 2 attempts after the drag and drop resulted in the export process simply getting stuck on the first image so I terminated the "Export Worker.

With 23 images in the List :-

On the third attempt (after terminating the export worker) success or rather the failure that I expected, i.e. image 22 and 23 both failed!

With 23 images in the list and ‘CPU only’ selected:-

This test also failed on the expected image but with a new twist.

The twist was that if I did the test with the GPU selected both images got an error, Image 22 and Image 23 but with ‘CPU - only’ selected only image 22 failed and image 23 was exported successfully!?

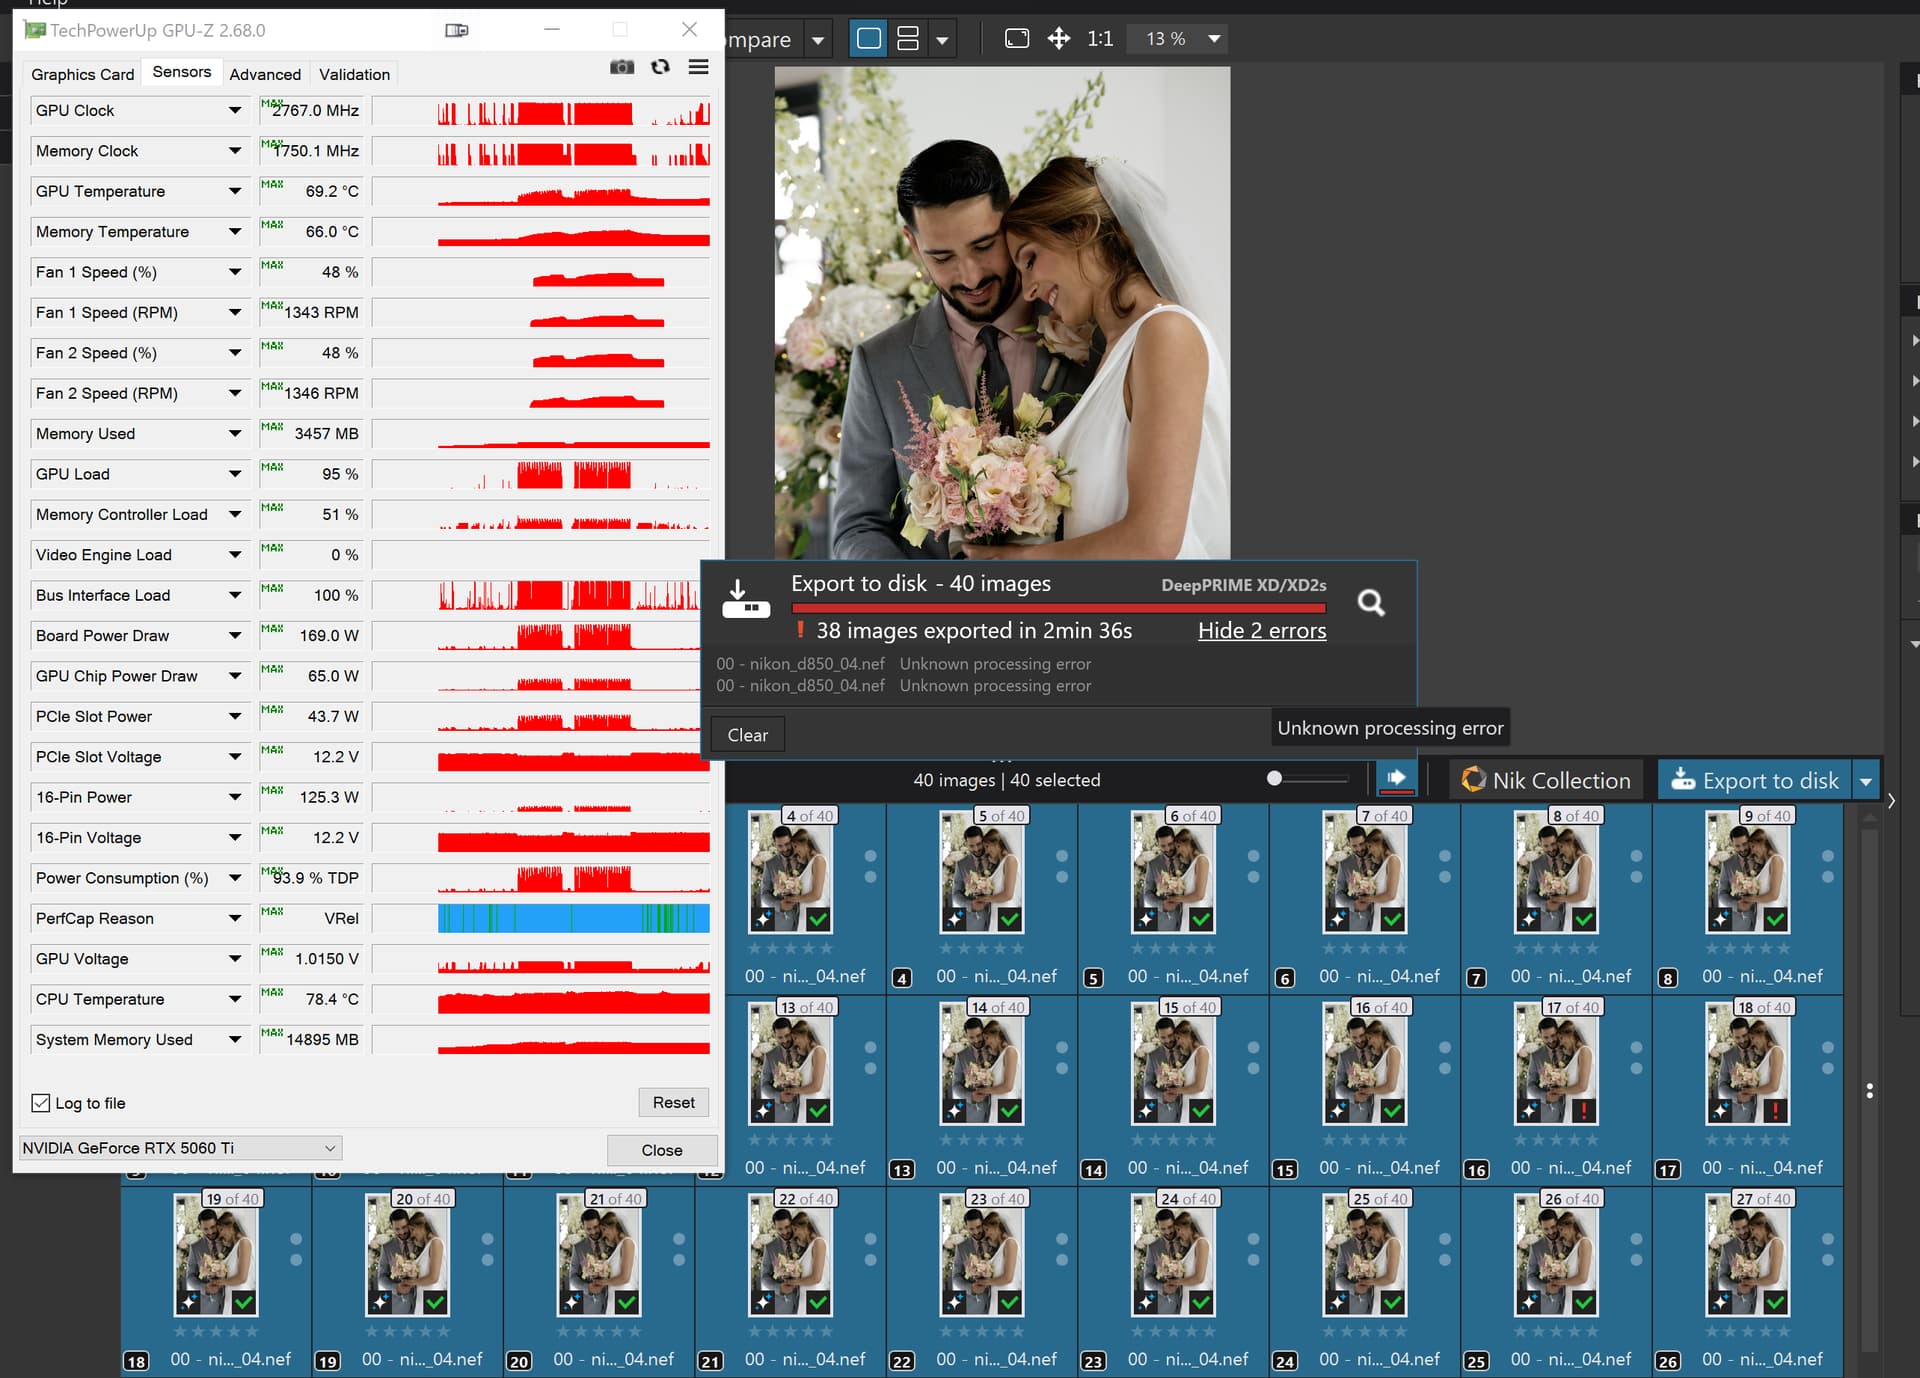
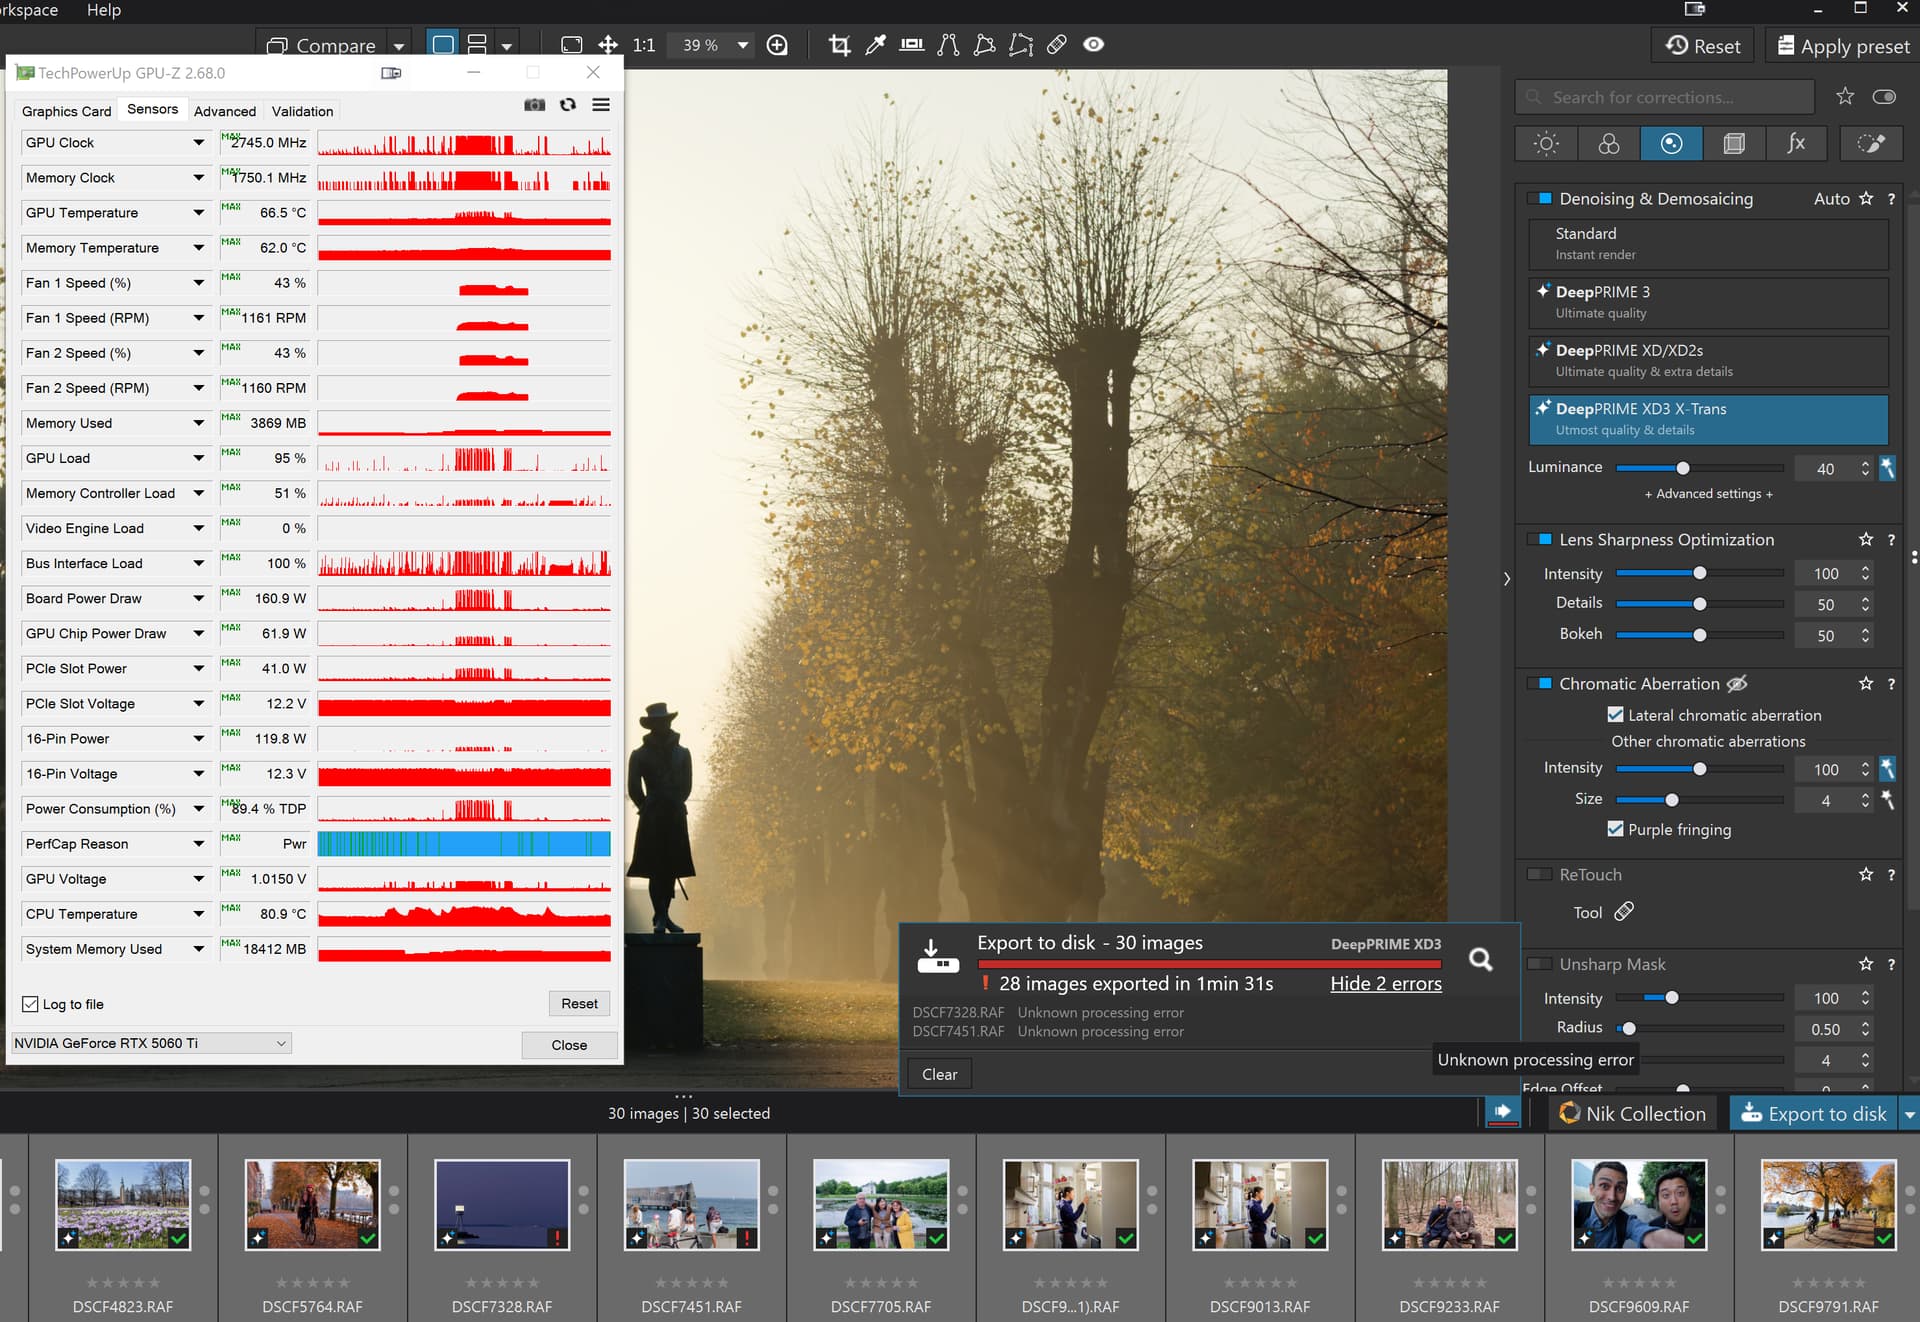
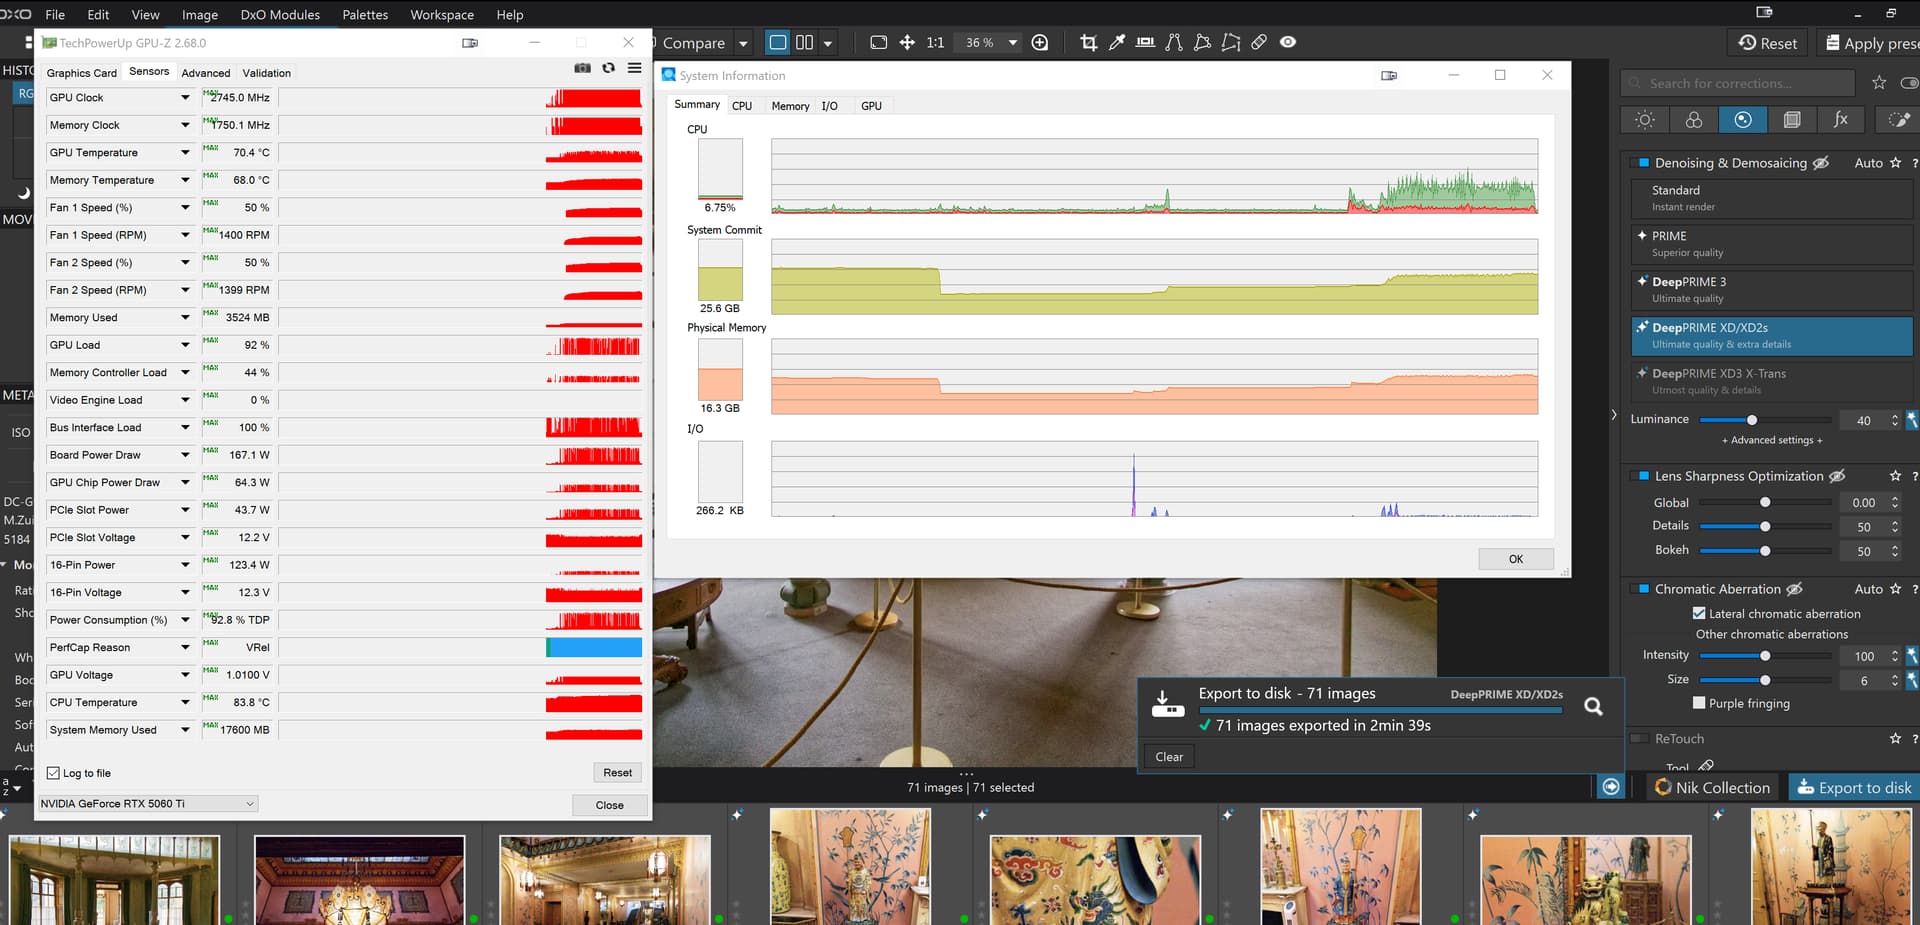
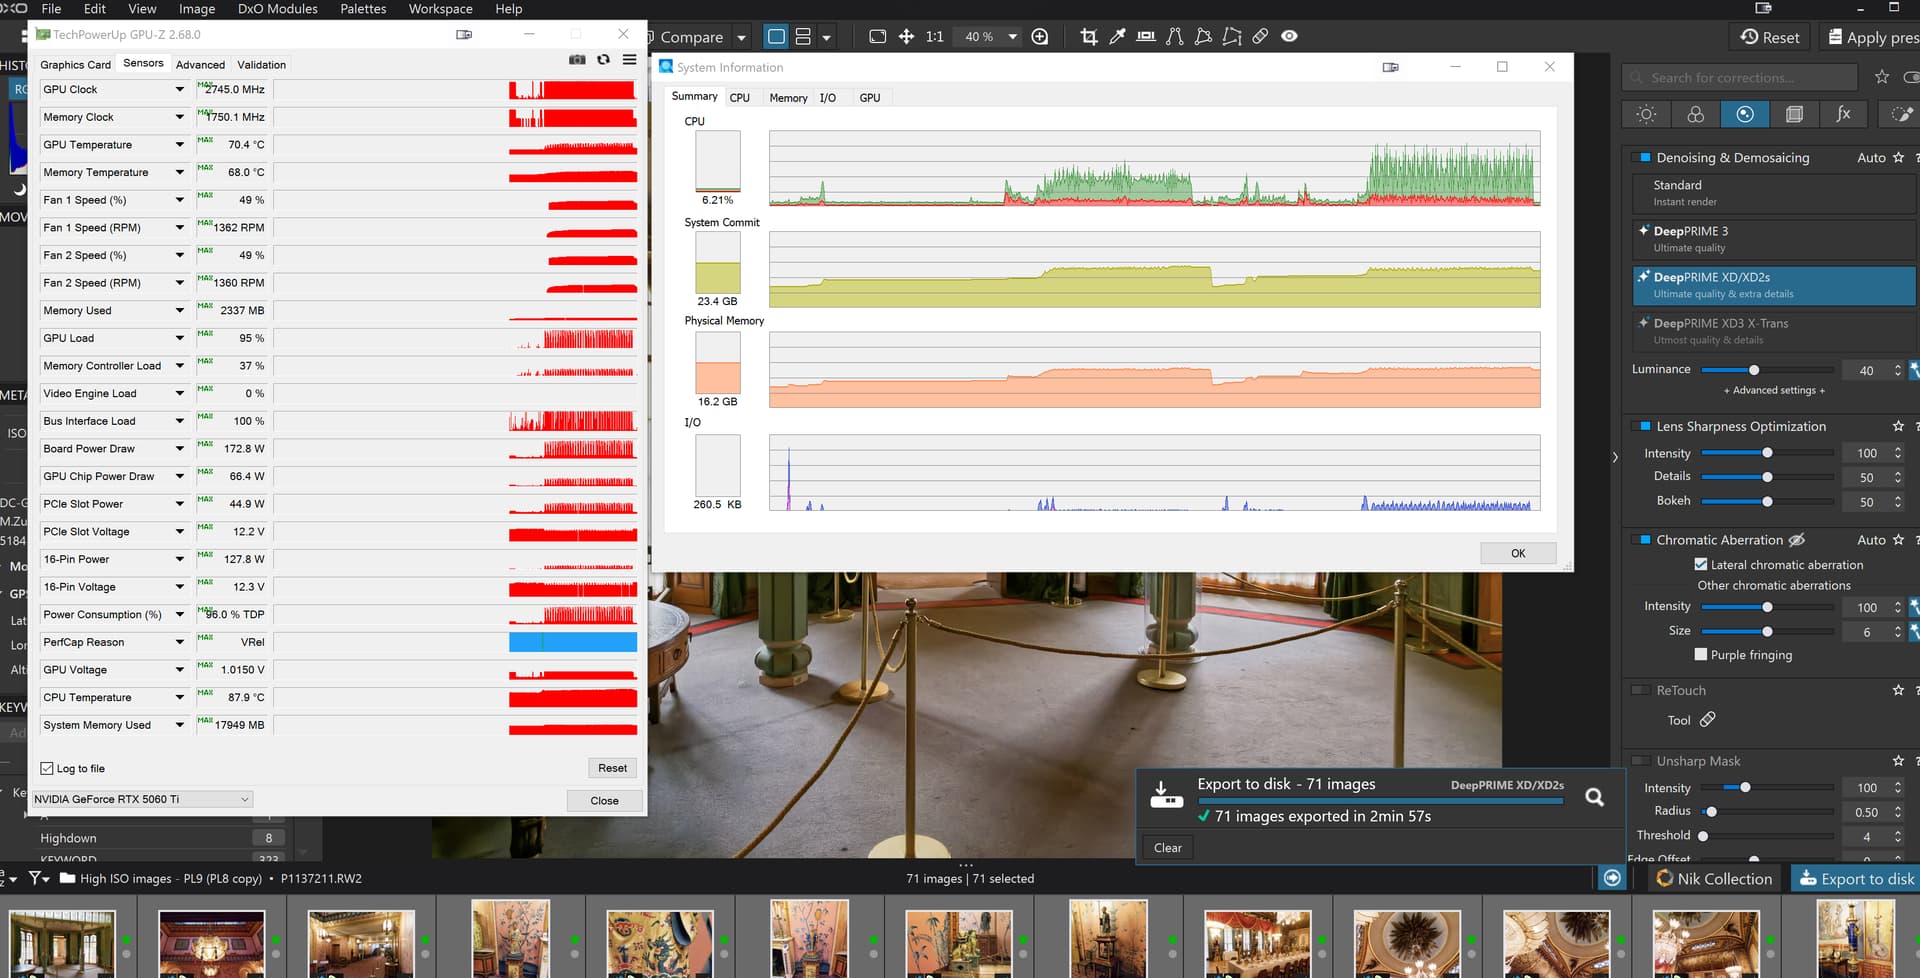
Since this topic is about the 5060 or 5060Ti I decided I ought to retest on the 5606Ti(16GB).

The first test was a mistake because I had left the XD3 active and the test failed on image 23, the one after the image that consistently fails on the the 3060(12GB) tests but those have NO NR

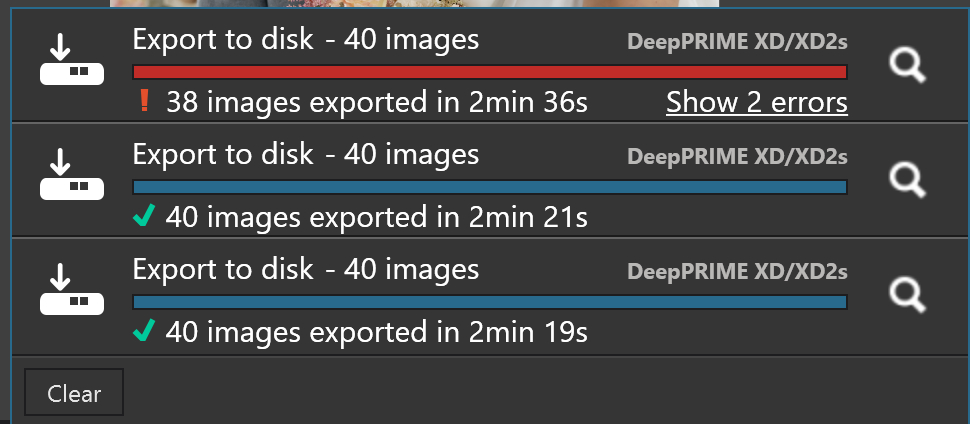
The second test was on all 30 images with no NR and that succeeded, when it has failed consistently on the 3060(12GB)!?

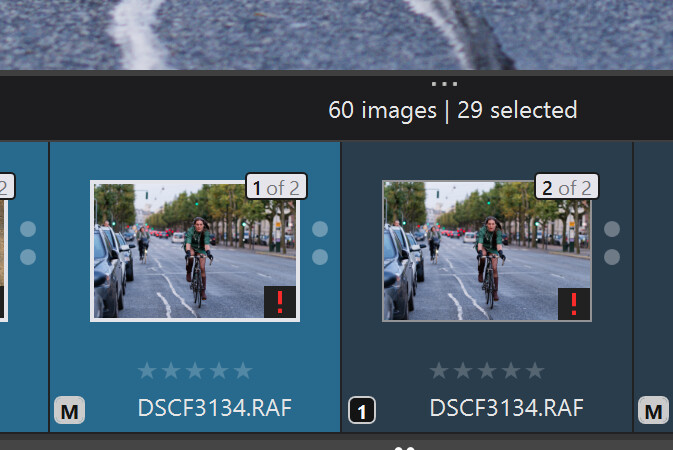
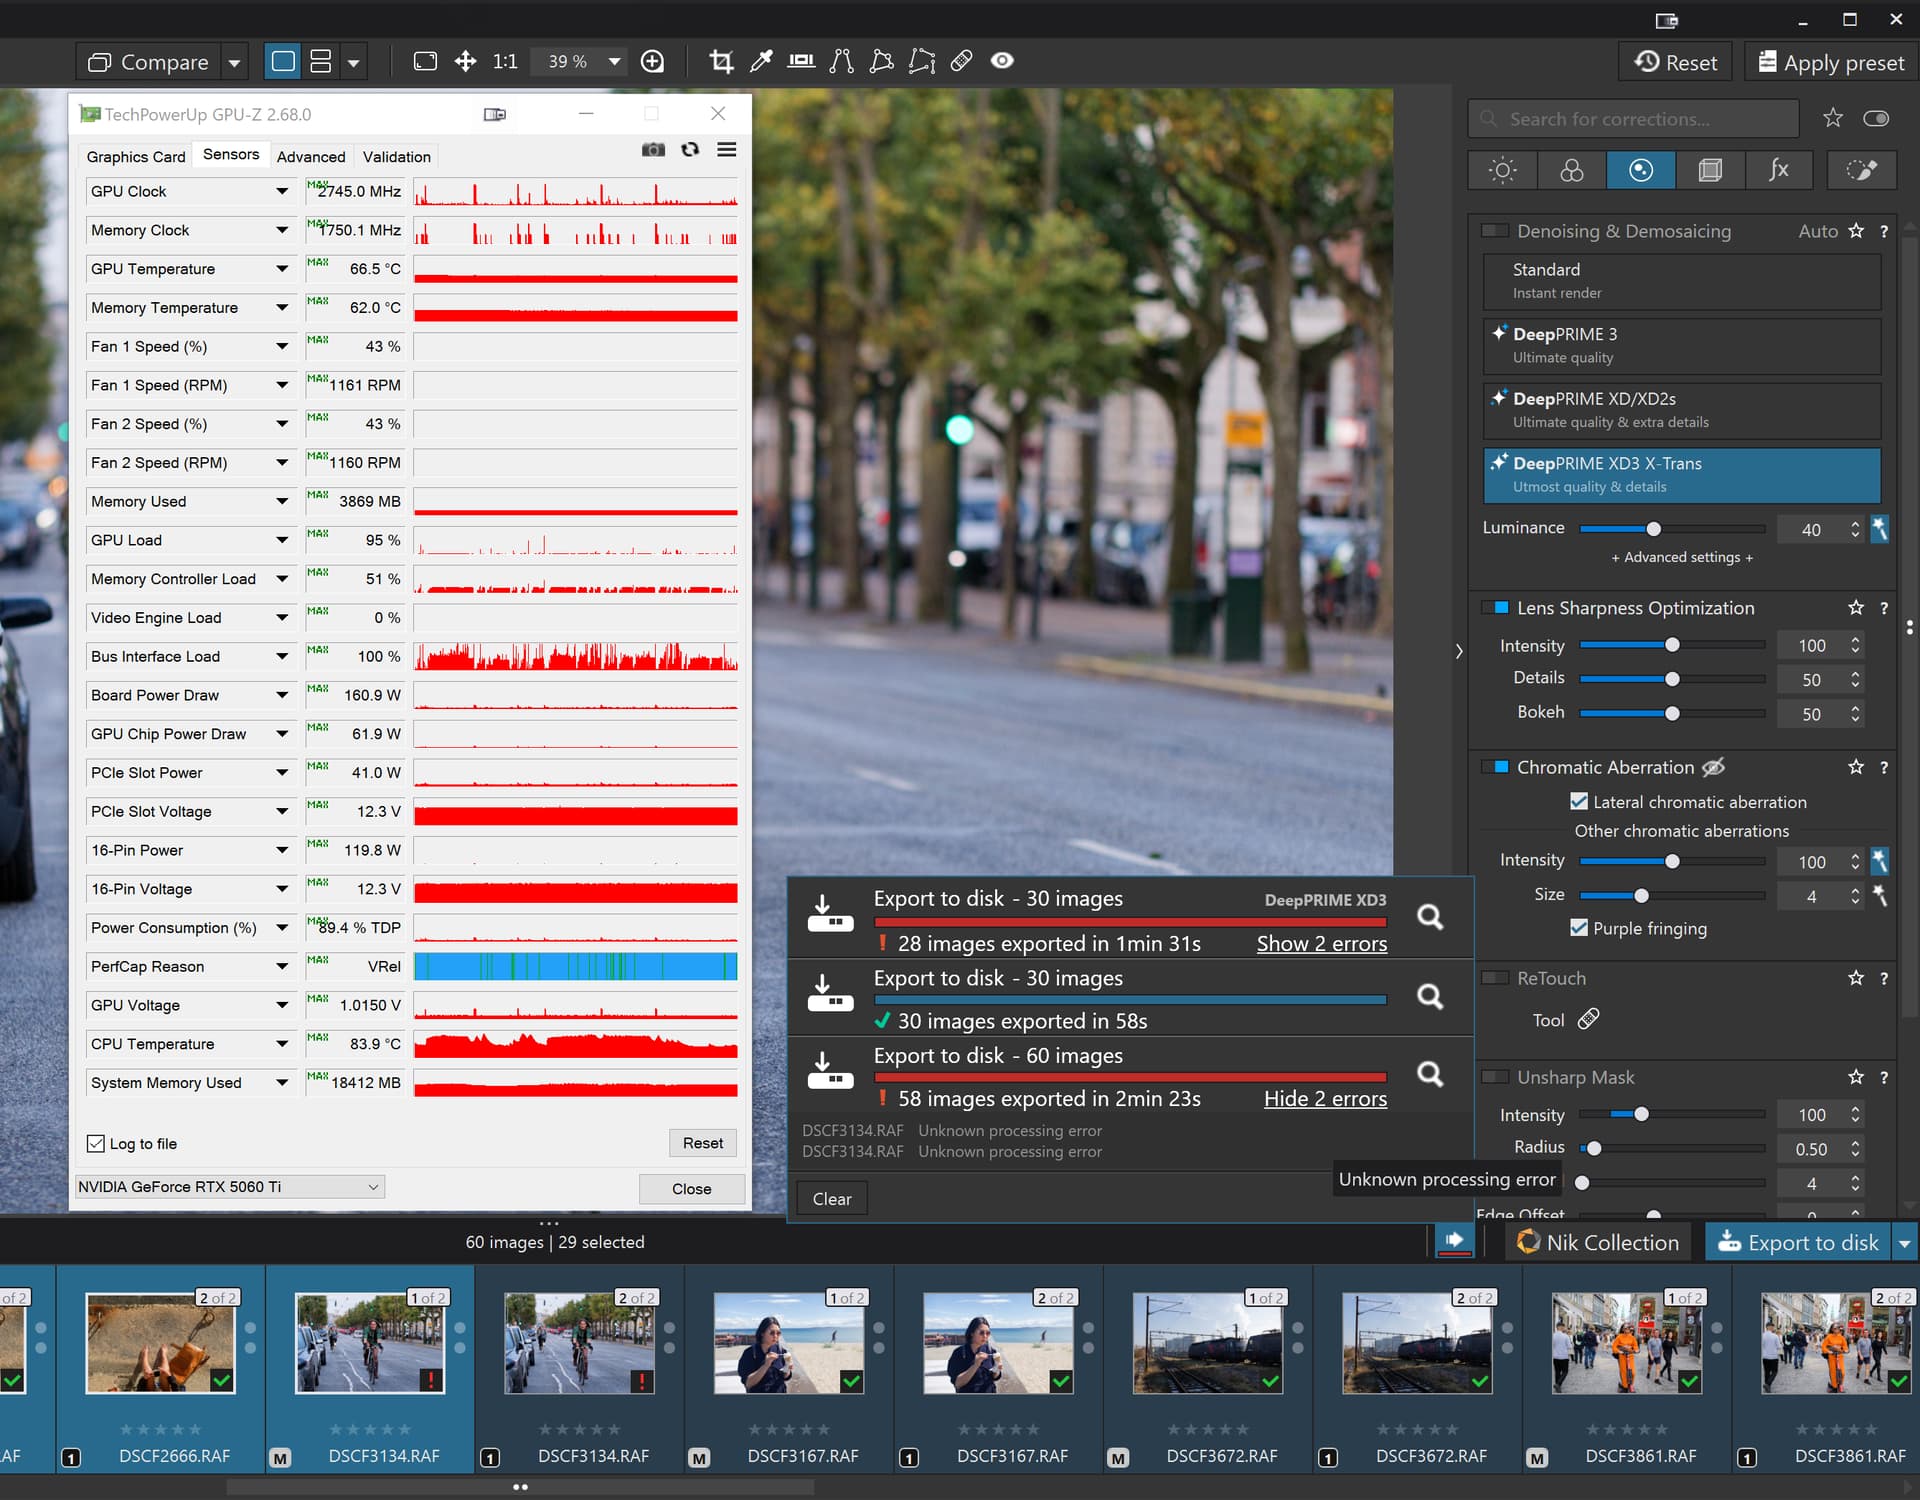
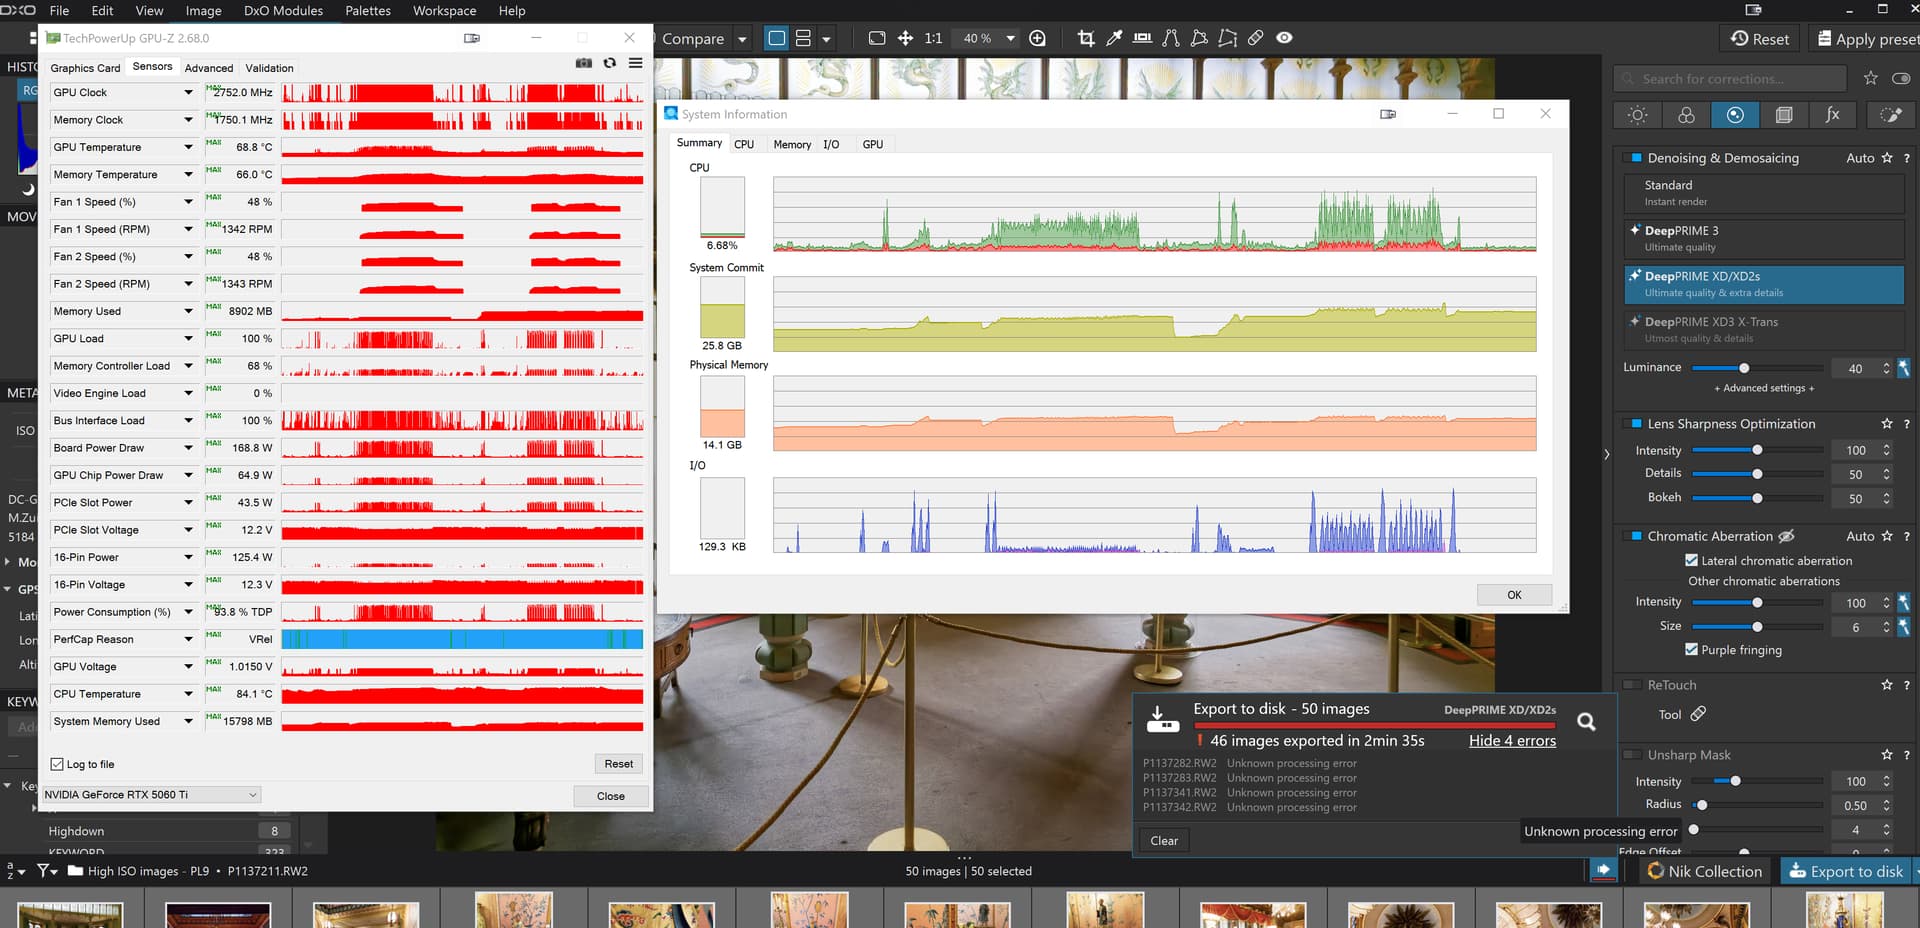
So I selected all images and created VCs giving a directory of 60 images and reran the test and it failed on image 29 (another lady on a bike image!!??)

So we have

Why the 5900X with 5060Ti(16GB) did not fail on image 22 with NO NR I do not know because the GPU should be irrelevant in NO AI and NO NR tests.

Repeated this test and PL 9.2 no longer crashed while GPU-Z was running. :slight_smile:

Export times with PL 9.2 are significantly longer,
which may be due to the strange “stuttering” visible in the screenshot.


Nov 14th – Just downloaded the brandnew version PL 9.2.1_542 (Win)
… and it’s the same.

@Wolfgang thank you for posting the differences between the two releases. I have noticed it during my testing but have been too focussed on trying to come up with an error avoidance strategy while we wait for DxO to fix the problems.

But your “stuttering” with respect to GPU is not the only difference between the way the two versions go about rendering images>

So I switched to an old group of high ISO images of mine and did a test on a 5900X(32GB) with RTX 5060TI(16GB) and images taken from and exported back to a conventional HDD, but, unfortunately the batches were of different sizes 71 images (including a few VCs) on PL810 and 50 images on PL92 and this was the result of running the PL9 straight after the PL810 test (PL8 had been shut down before the PL9 tests but no Sleep to clear VRAM)

The PL92 test failed twice (four images involved because I am running with 2 export workers selected).

As you noted @Wolfgang the pattern of GPU usage is different but so is the pattern of CPU and I/O different!?

Obviously I needed to rerun the tests again so I created a new directory for the PL9 images and copied the images and PL8.10.0 DOPs to a new directory, same drive and located behind the directory used for the first test.

  1. Sleep the machine
  2. Run the PL8 test and gather snapshots
  3. Close PL8 and open PL9, discover the new directory and select all images.
  4. Sleep the machine
  5. Wake the machine and start the export, no PL9 failures this time
  6. Take snapshots

The outcomes are

PL8.10.0:-

PL9.2.0:-

So we have

PL9.2.0 is using “somewhat” more processor and taking longer to get the job done. I believe the PL8.10.0 I/O figures are too low, possibly as a result of copying the directory to create the PL9.2.0 test directory!?

So from the first test where I had failures the figures were

But the lesson here is probably to shut the machine down completely before executing the tests, i.e. set up the tests on PL8 and on the PL9, terminate and shut down and then execute the procedure I listed above to see if a more realistic set of I/O statistics can be obtained.

What have DxO done to the export process to create such a disparity between the resources used between PL8.10.0 and PL9.2.0?

1 Like

It might be even more complicated :wink:
For example, with 576.02, reading GPU temperature got stuck if system went to sleep and was rewoken (a bug, fixed later). Shutdown/start did not return reading to normal, only restart did. That was because of Win11 Fast Boot feature, enabled by default. See e.g. reply by marioho in https://www.nvidia.com/en-us/geforce/forums/game-ready-drivers/13/563331/wrong-temperature-reading-in-new-drivers/ , which matches my experience. I have no idea what exactly is preserved in nvidia driver/card state across shutdown/start with fast boot enabled and sleep/wake sequences.

Meanwhile, see the update at I’m experiencing issues with AI Masks in PhotoLab 9 on Windows using the latest NVIDIA drivers. What should I do? – Help center :
"
Note for NVIDIA RTX x60 models (2060 / 3060 / 4060 / 5060)
These models are affected by a known WinML issue. Until NVIDIA releases a fix, you can:

  • Use CPU processing for these operations, or
  • Avoid AI Mask keywords temporarily.

We are closely monitoring the vendor’s update.
"

Don’t know what the ‘known WinML issue’ is, but maybe it’s affecting not only x60’s?
Some of my crashes with 4070 seem to be related, with DirectML in the crash stack.

PL 9.2.1 - zero errors during processing
processing time approximately 15% faster