Nothing really strange here, image #1 finishing about the same time as image #2 (they start almost together, with the default 2 “export threads” used). Any hints in the logs?
The only strange thing was that for Z8 raws typically I get about the same export times using DP3, Standard, or NoNR, but with GFX100 the difference is noticeable.
Initial VRAM/Shared GPU memory usage before PL9.6 start was 1.1/0.1 GB out of 12.0/16.0 GB available. After PL start in the directory containing only this RAW and dop with 1+6VCs images it was 2.9/0.6 GB.
For the same set (one 103mpx RAF, 7 images, 6 with multiple various AI submasks) I get the following times and VRAM/SharedGPUmem usage after export finish in PL, each run after fresh PL restart:
NoNR – 35s (20.5mpx/s)
DP3 – 48s (15.0mpx/s), 8.3/0.8 GB
XD3 – 86s (8.4mpx/s), 5.9/0.8 GB
(there’s GPU memory leak with NoNR or Standard, described elsewhere, so I didn’t show it here).
With Local Adjustments (LA) disabled, the initial VRAM/Shared GPU memory usage was 1.5/0.3 GB after PL start (compared to 2.9/0.6 with LA enabled). Batch export time and VRAM/SharedGPUmem usage:
NoNR – 29s (24.8mpx/s)
DP3 – 37s (19.5mpx/s), 2.2/0.4 GB
XD3 – 62s (11.6mpx/s), 2.1/0.4 GB
Virtual memory reservation went very high, well over my RAM size, but I have swap auto settings, so no problems with that.
For Z8 I get about 10-12mpx/s for XD3 and 20-25mpx/s for DP3 batch exports without LA, but the variance can get much wider for complicated edits.
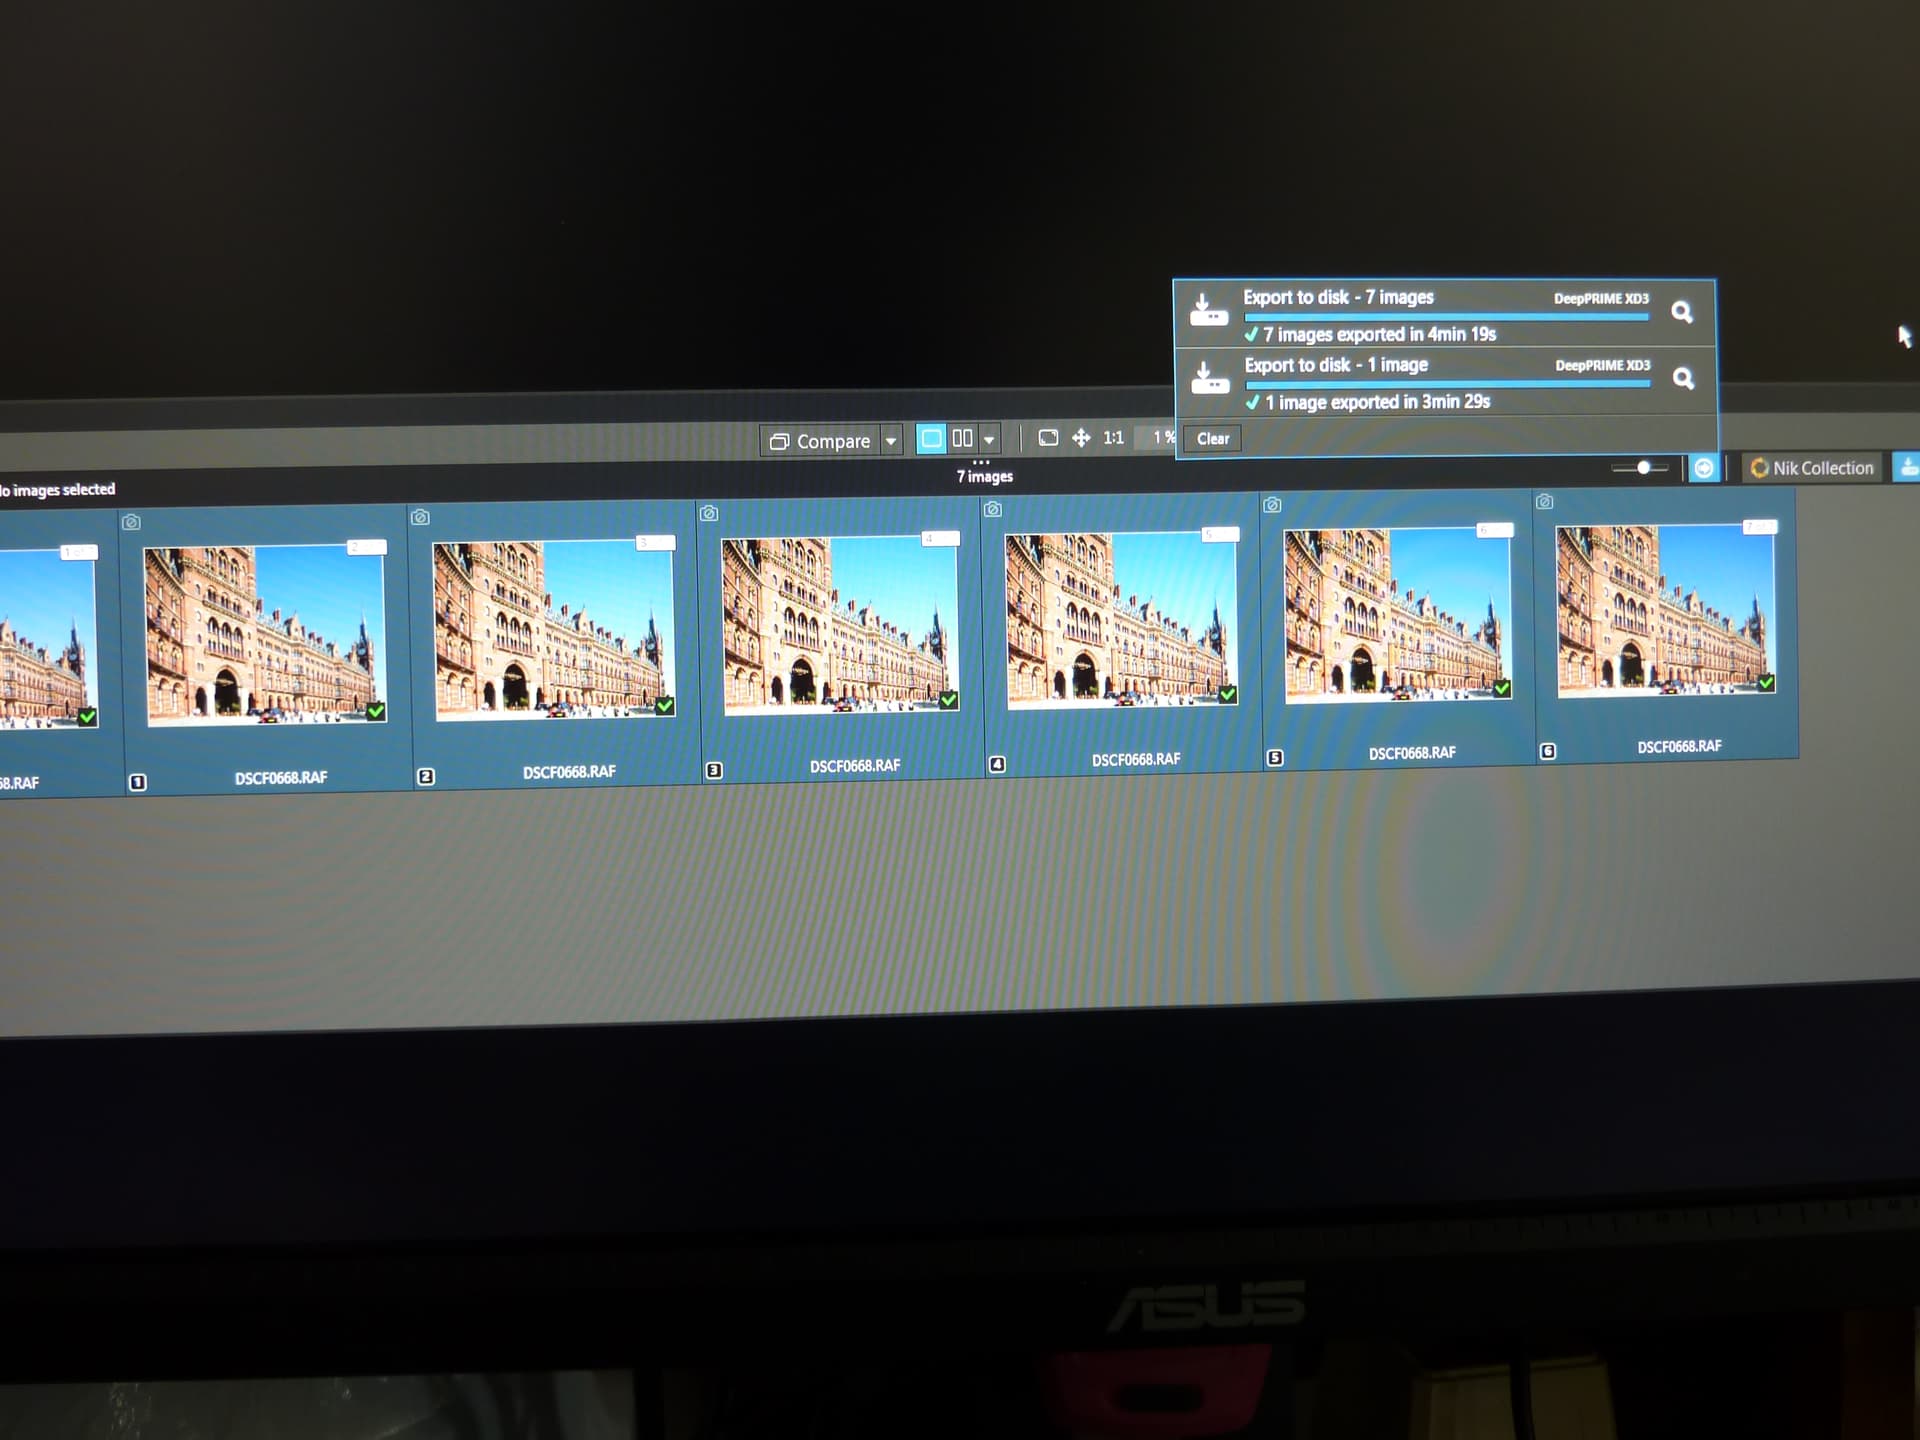
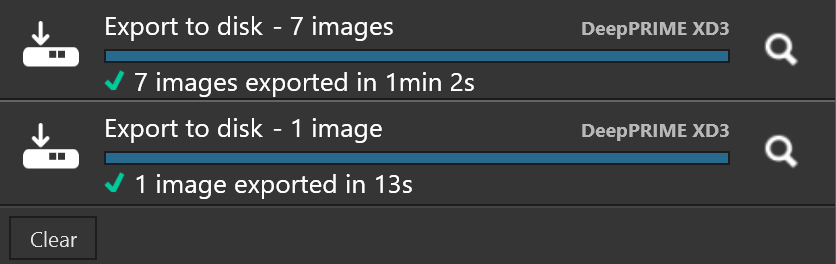
During batch export processing (2 threads/Windows) image #1 requires some additional action, so it’s not that rare that processing image #2 ends before #1, but the difference should be marginal. In my case image processing as shown in activity icon finished either sequentially or in this order: #2,#1,#3, the rest in–sequence. I did also export of all 7 images followed by export of the master image only. Result:
So the average time for the first run was about 9sec per image, but since two export threads were used, it was actually 18sec. Since master image is the only one without LA, it’s processed faster than 18sec when processed standalone. When it’s processed in a batch, as said above image #1 requires some additional work, so it may finish later. However the difference should be small, unlike in your case. You may analyze PhotoLab and DopCor logs to get some idea, but it’s a bit tricky, since PhotoLab log does not currently show image name (but DopCor log does). Note that processing times shown in PhotoLab log are NOT full processing times, you have to analyze both logs together to get that.
Your driver 511.09 is from January 2022, so there might be some compatibility issues with new WinML libraries in PL9.6. Just speculating, it may switch to some old mode and you may run into GPU memory leak problem, as in pre 9.6 versions. Check GPU memory usage in Task Manager, both “Dedicated” (VRAM) and “Shared”. Check with 595.79 studio driver – it still supports GTX1660 SUPER.