One problem when you start monitoring a system is that it can become excessively compulsive behaviour, particularly when you have invested money to improve things, add new functionality etc. and you want to believe that you are achieving the “best bang for your buck” (vindicated in your choice) and therein lies a “curse”
So I installed the latest game drivers and the performance of the new card (RTX 3060) seemed to decline (and appears to have not “recovered” fully since).
Installing the card also “upset” my BIOS settings and while I am sure that the tests that I did and reported were with the machine running overclocked at 4.4Mhz it did fall back to 4Mhz when I revisited the BIOS to “fix” something else and was running at the slower speed when I installed the new graphics drivers.
I have reverted to the old drivers and resolved the overclocking issue so that the machine is running just short of 4.4Mhz (effectively a 10% overclock) but cannot exactly repeat my original test figures, although they are very close.
But here are some figures to get your teeth into and they are along the lines that only looking at the overall figures timing figures can distort the picture somewhat so I have run tests without any Noise reduction to try to define what might be expected from just the CPU for the edits and rendering the image, i.e. the part of the processing that is CPU only from the part that is largely GPU but with CPU management.
These have all been done with 2 simultaneous exports and it is possible with the more powerful processors that more simultaneous exports may well improve things and lower the overall run times.
Processors fighting it out alone:-
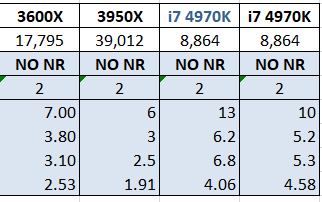
I got access to my Grandsons and Sons machines yesterday during a visit to Bromley and ran some repeat tests. The “NO NR” (No Noise Reduction) tests and got the table above. The 17,795 etc row is the passmark score for the processors and an estimate for my two i7 4790K’s running at 4.4Mhz (uplifted from a passmark score for a standard I7-4790K).
The main issue is that my two columns should be identical but DxPL runs as
which means is designed to ensure that it does not “crush” other programs but then other programs can push DxPL aside and one machine in particular is hardly ever idle, i.e. there is lots of background CPU activity/
Given that the power of the machines is roughly 2, 4.4, 1, 1 that is not quite borne out by the resulting elapsed times recorded for the machines, i.e. other factors might help understand what is going on which I did not have the time or software to investigate like
- How busy were the processors (it was using over 50% of the I7’s)?
- Would increasing the number of simultaneous exports from 2 actually have worked for the faster machines?
I believe I have addressed an error in the first chart, also reflected in another snapshot later and changed the i7 I used as a baseline (now consistent with all the other performance ratio tables)
Which show as 1.86, 2.167, 0.77, 1 using the Main machine (RTX3060) as the baseline (1), i.e. we have a ratio of CPU “power” for this specific task as follows (I have definitely “gone off” Excel!)
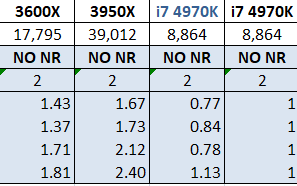
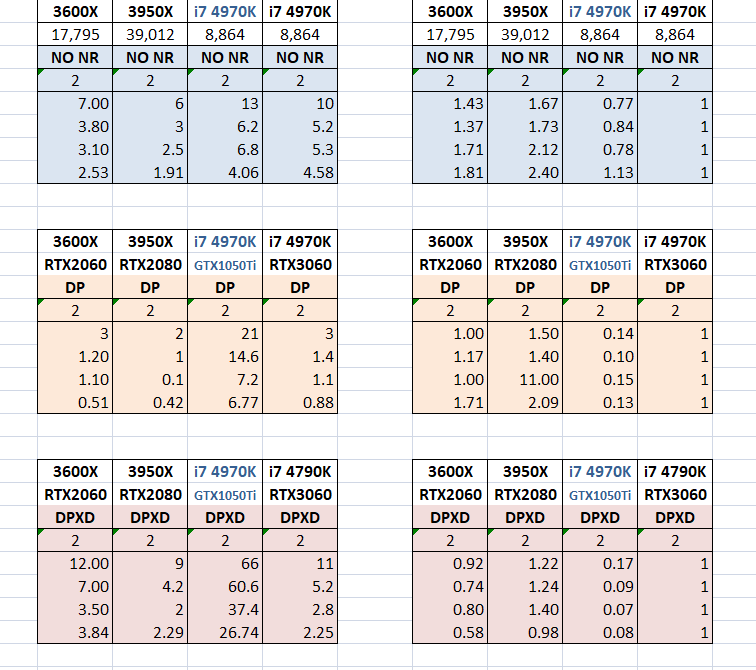
So for the Egypt image the editing on the 3600X was 1.43, 1.37, 1.71 and 1.81 times faster than the Main I7 for Egypt, Nikon, BHT(10) and BHT (109) images, respectively.
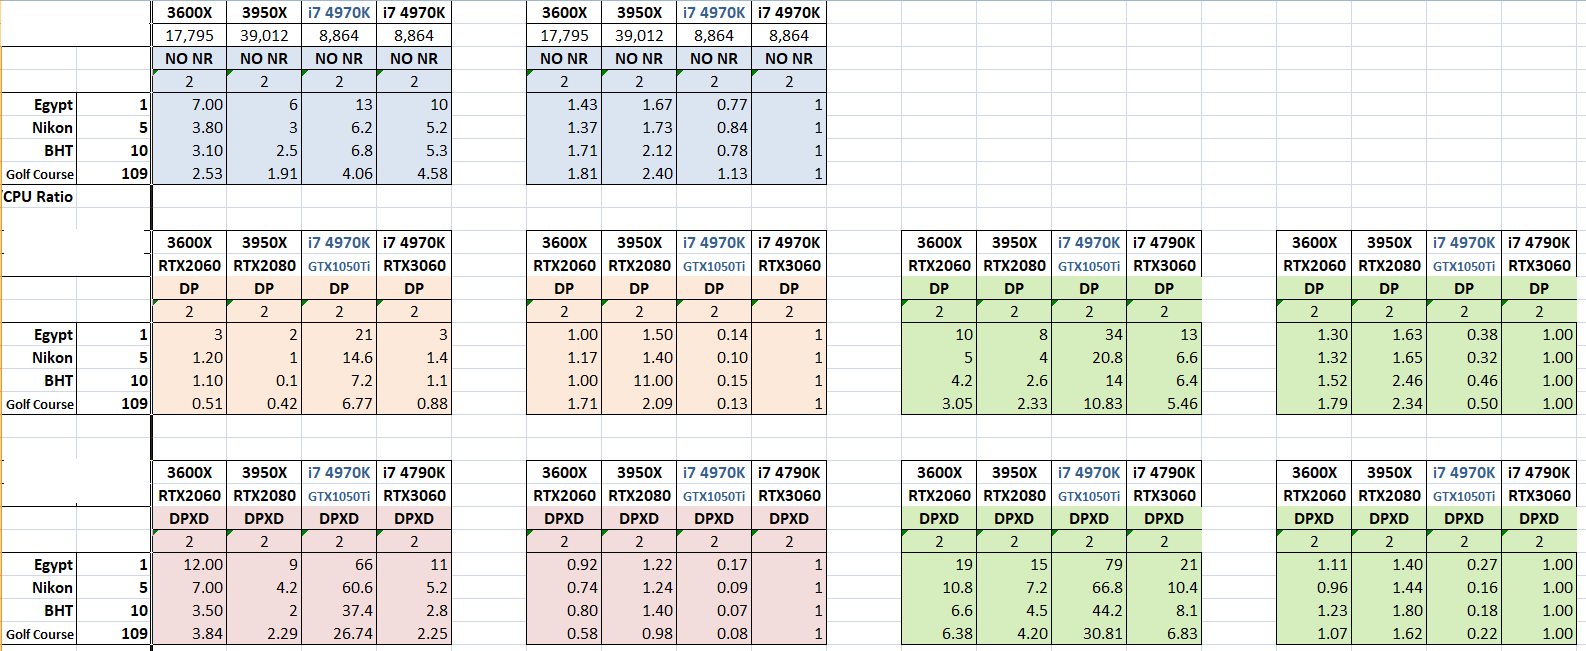
The whole picture:-
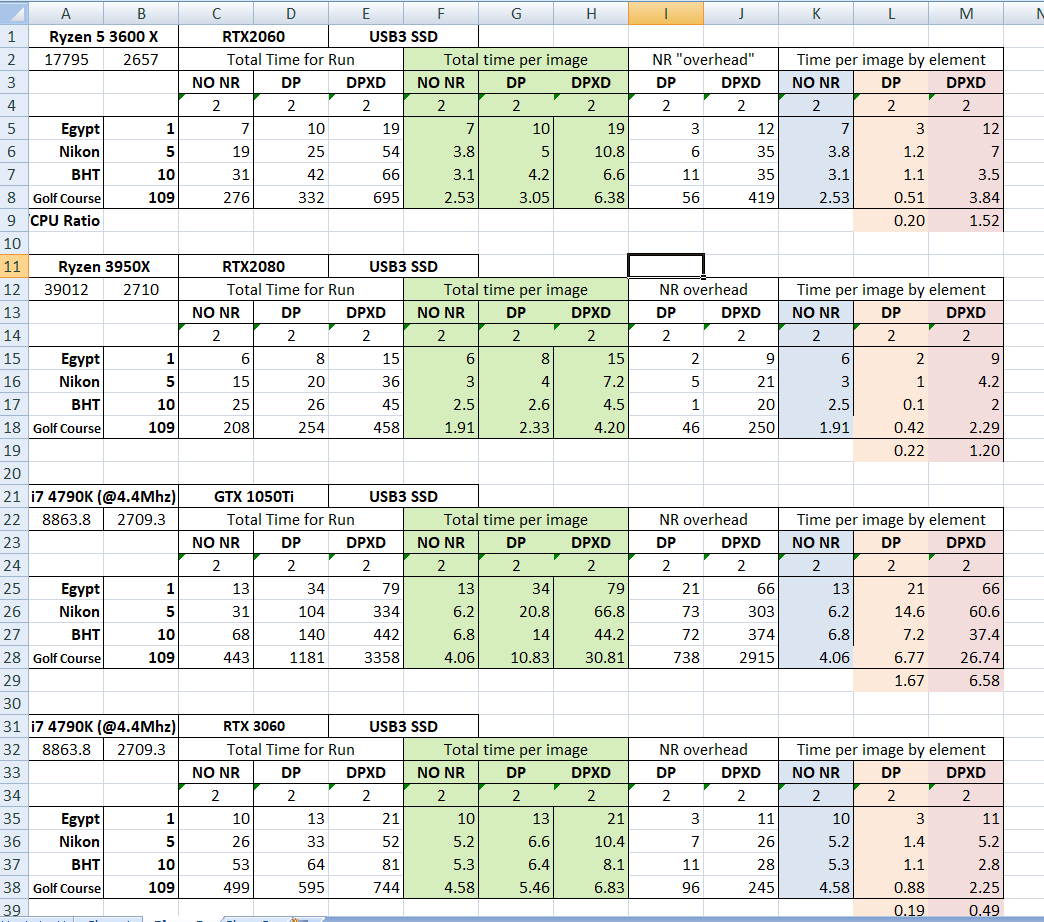
These figures were derived from this sheet
Which leads to the following summaries and “performance ratios”
I believe that the RTX3060 outperforms the RTX2060 in DP XD but not in DP (?) and the RTX2080 outperforms both but not by a huge margin (the "law of diminishing returns maybe) but may have been able to take on more than 2 exports at the same time.
However, while a 1 second difference per image “only” amounts to 100 seconds for 100 images it is 1,000 seconds for 1,000 images i.e. nearly 17 minutes.
Plus I believe my Grandson’s RTX2060 may have problems because the fan noise while doing DxPL DP XD was very loud, while my 3060 and the 2080 (which I believe is a Ti but neglected to check) the noise increased slightly (both machines run with the side off)
The GTX1050Ti is out of its depth!
Standard caveats apply and more so because of the various versions I created trying to present the data and the fact that a rogue formula may have crept into the calculations or more likely I copied the wrong data to the wrong place.
The spreadsheet is available if anyone wants it.
PS:- it would also be interesting to compare the figures shown in green, i.e. the “total time” figures and derive ratios to show how well they reflect the performance differences (and show that the above was actually a waste of time and you can rely on the overall comparisons after all).
The following table provides labels for the lines and includes a comparison of the per image elapsed times and derived ratios with no split and using the DP test figures which the Google spreadsheet was originally set up to test, plus the newer DP XD figures.
and the two figures I am having real difficulty with are the “Golf course” DP XD figures for the RTX2060 but particularly for the RTX2080?
