Ah, yes, you are right. One normally doesn’t notice this in everyday usage, but your greyscale ramp image is good to discover things of that nature.
So here is a summary of my observations on how tonality tools work in PhotoLab 2:
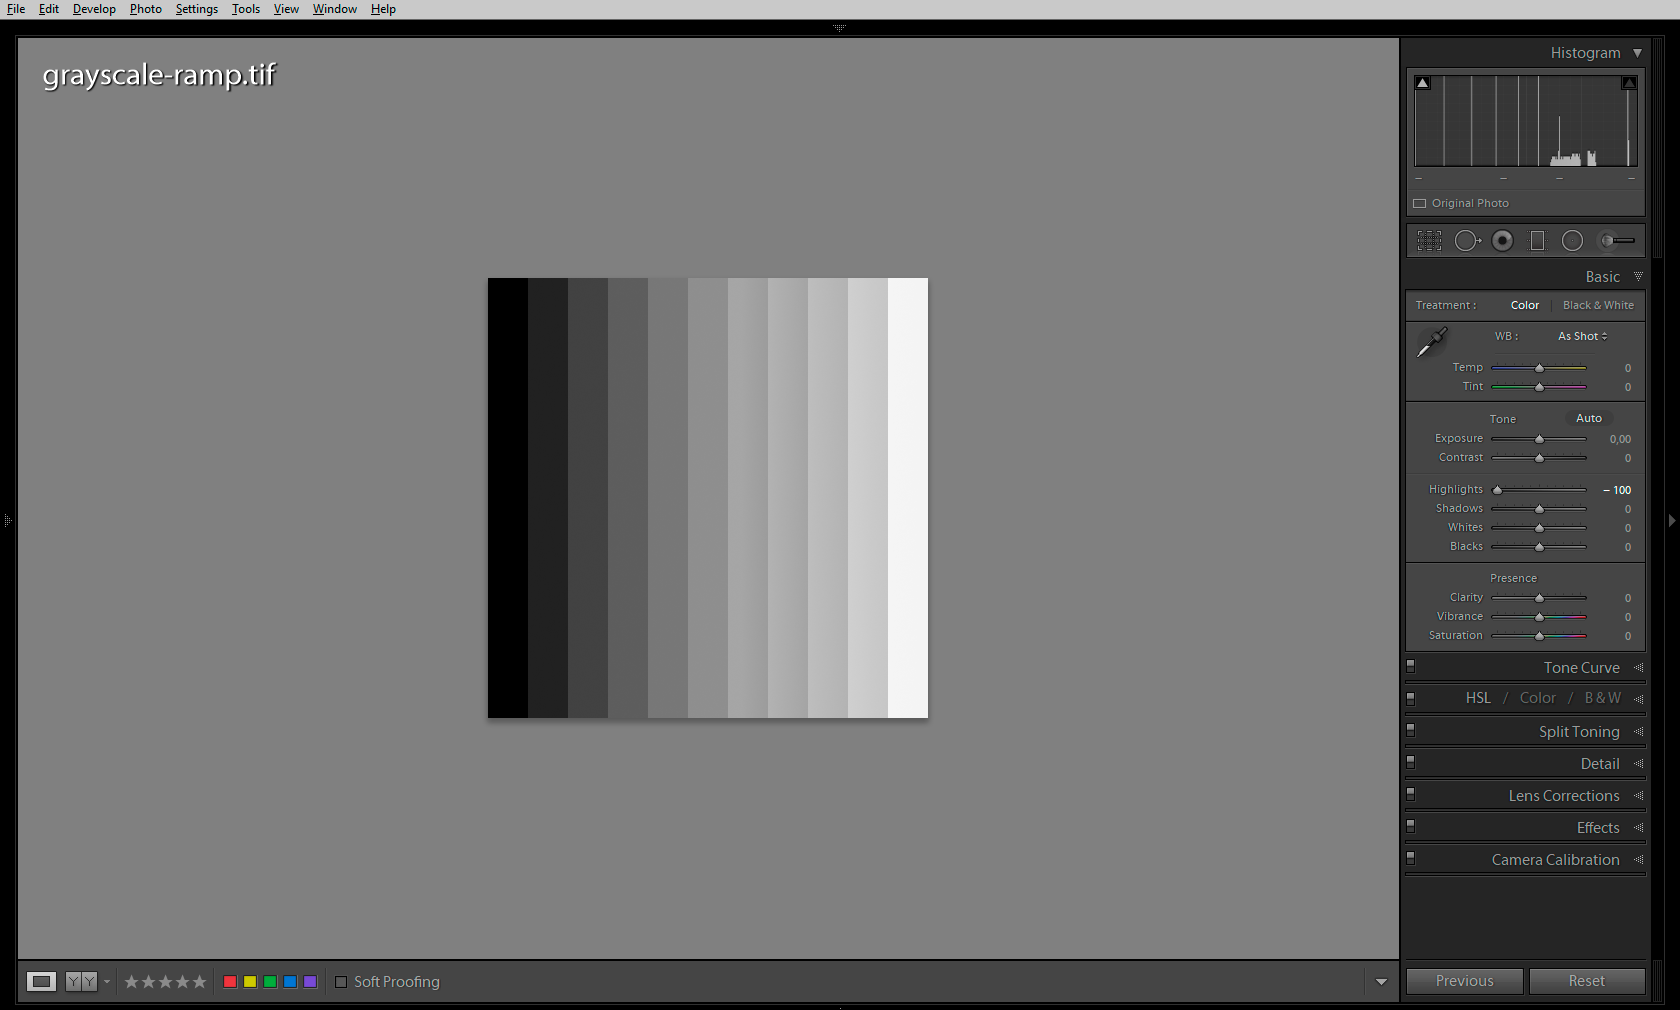
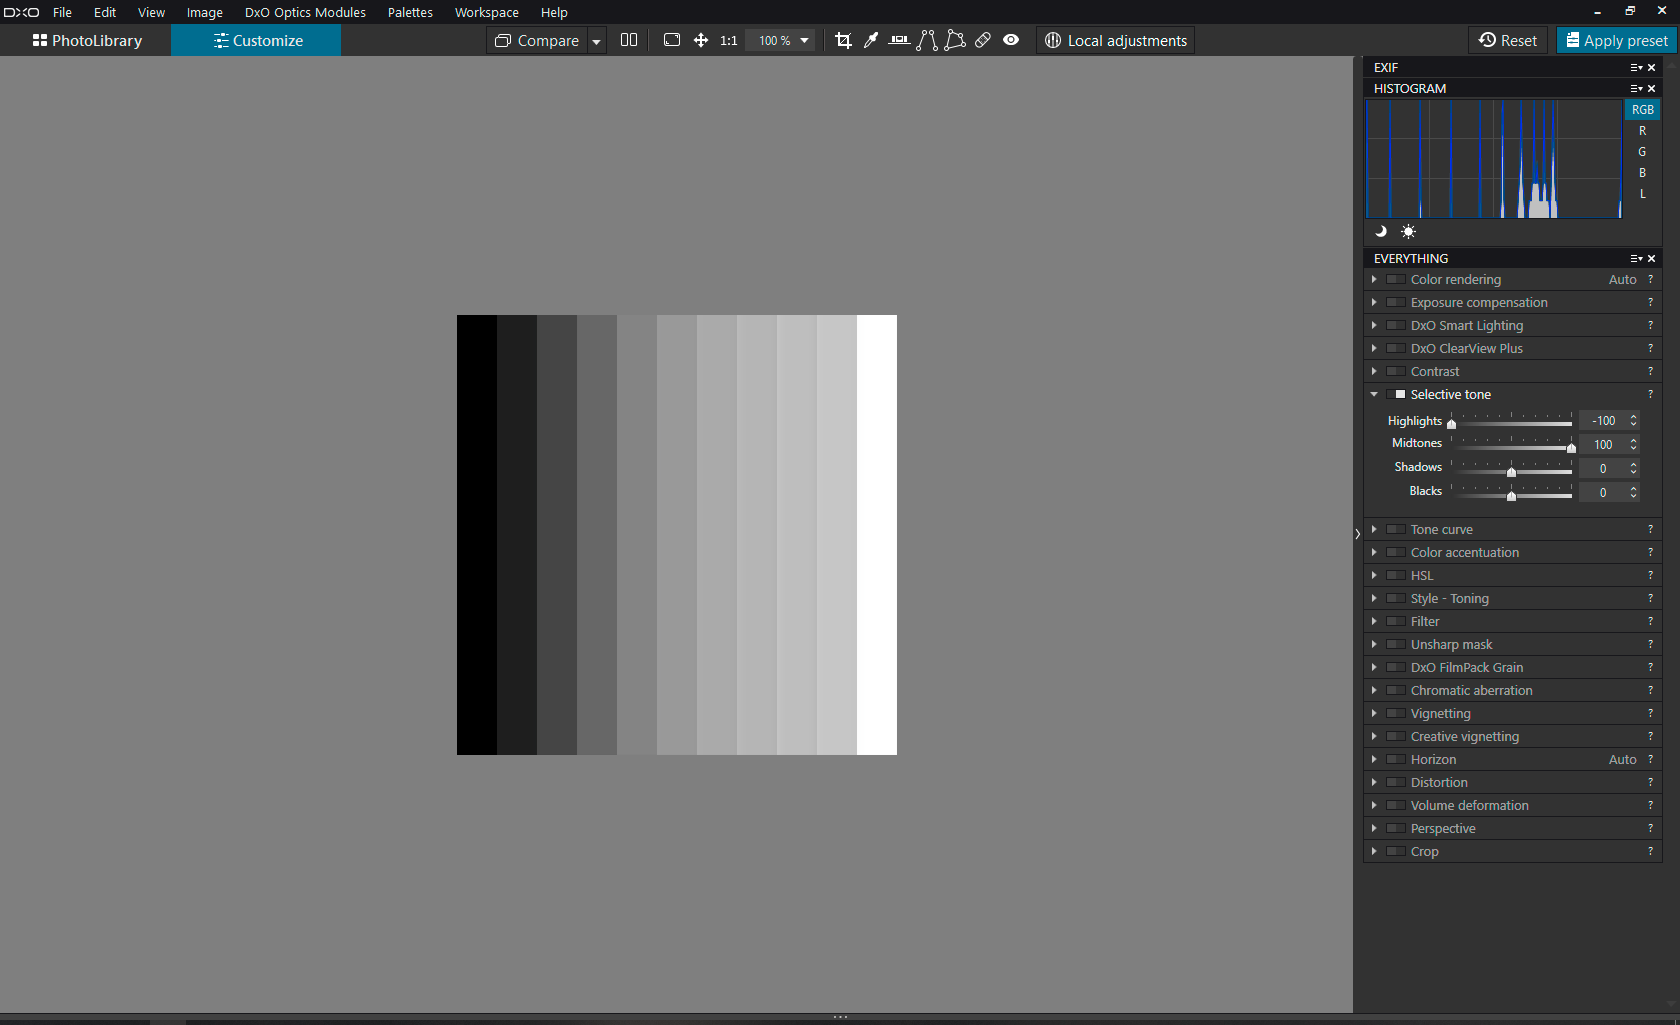
- It’s interesting that the PhotoLab RGB readout under the histogram shows the black strip [RGB 0/0/0 as seen in Affinity Photo and Lightroom] as [RGB 2/2/2]. It looks like a bug to me.
- The white strip [RGB 255/255/255] is reported correctly.
- None of the Selective Tone tool sliders alters the black and the white point values. This is unlike in Lightroom, where [-100 Highlights] changes the white point L(a b) value to 96.4%.
- Lightroom’s [-100 Highlights] is more or less equal to PhotoLab’s [-100 Highlights; +100 Midtones], see the screenshots:
- The screenshots above also illustrate how Selective Tone sliders modify local contrast in addition to global contrast. Note the thin vertical lines in the histograms get lower and fatter as a result of the local contrast manipulation. Other tools simply move the thin vertical lines around.
- PhotoLab’s local contrast effect is applied by the Selective Tone tool, as well as the Smart Lighting and ClearView Plus tools. The Contrast slider and the Tone Curve do not do any local contrast enhancements.
- Lightroom’s Hightights/Shadows/Clarity sliders apply stronger local contrast corrections (prone to haloing) and as far as I remember are not just HiRaLoAm using the simple USM/Gaussian-blur-based filtering, but make use of Laplacian pyramid.
- PhotoLab’s Microcontrast slider looks like a straightforward HiRaLoAm – you could simulate it by using the Unsharp Mask tool with something like [50 Intensity; 5 Radius], etc.
- A typical “HDR-like” setting in Lightroom [-100 Highlights, +100 Shadows] can be simulated in PhotoLab by moving all four sliders [-100 Highlights, +100 Midtones, -30 Shadows, +100 Blacks]. Settings like these are prone to haloing, though, because of the local contrast enhancement hidden behind the sliders.
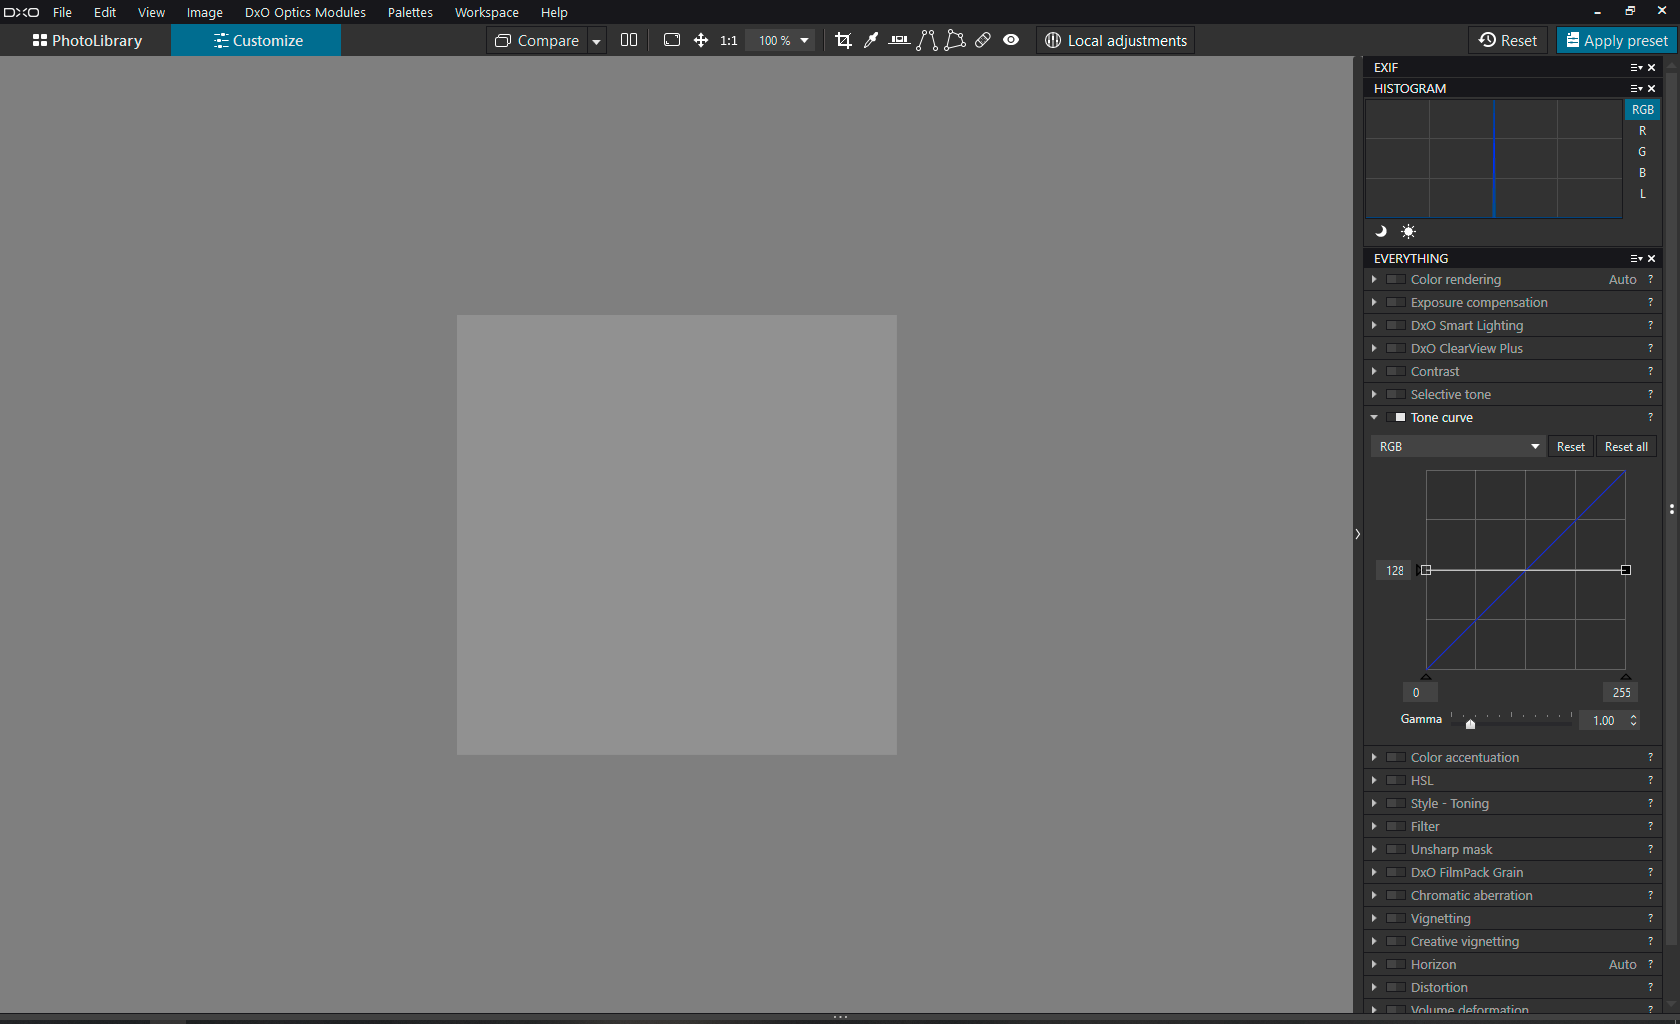
- To get the greycale ramp perfectly grey, you need to use the Tone Curve Black/White Output triangles (the Y axis) and move them to 128 on both sides of the curve.
- Tone Curve’s Gamma values above 1 build a Shadows contrast and compress highlights but do not cause highlight clipping (Black and White points are not clipped). Gamma values below 1 create highlights contrast at the cost of clipped Blacks.
- The Contrast slider behaves like a typical S-shaped Tone Curve, i.e. it also affects saturation levels in addition to global contrast.
- In PhotoLab 2, the HSL tool has a Lightness slider which can alter global contrast when the All Channels options is selected. Maximum values of Lightness clip to Black or to White (there’s no shadows/highlights protection). This should be different in PhotoLab 3 because of the different colour model used by the improved HSL tool.
As far as a practical application of the above, see e.g. Thomas Niemann’s pdf file, which has some good suggestions on the second page.