PL9.1.0 Win with NVidia 581.42 Games drivers still fails

@KenA Sorry I did not test that driver earlier. PL9.1 does seem to be behaving itself with the 3060(12GB) and the 576.40 drivers (!?)

The Release notes have a caveat on the end and I really feel that DxO should have amended the main body of the release notes and not just tacked it on the end.

However, while I have a 2060(6GB) and a 3060(12GB) and a 5060Ti(16GB) at my disposal to test I do not have any graphics card with 8GB.

My concern is that when using the 3060(12GB) the VRAM usage approaches 12GB and when using the 5060Ti(16GB) it goes a bit over 15GB, is this real usage or is this just PL9.1 using as much space as available rather than confining itself to just what it needs?

Do you have a 3060Ti(8GB) or a 3060(12GB) or a 3060(8GB)? At the time I bought the 3060(12GB) it was only being offered with 12GB, possibly because it didn’t meet the speed that NVIDIA wanted for the price point(?) but I believe that you can now buy a 3060(8GB) card.

If anyone is thinking of buying a 3060 then make it the 12GB model. As for whether anyone should be tempted to buy an 8GB GPU lets just say that when I decided the the 2060(6GB) was passed its “use by date” I bought a 5060Ti(16GB) board.

But all that might change within a new release or two of PhotoLab. :crossed_fingers:

I think PhotoLab just sends command queues to GPU and VRAM management is done by the Nvidia driver and the encapsulating Microsoft code, memory usage being adaptive. Without full internals knowledge, it’s easy to arrive at “logical” but wrong conclusions, so better just wait for fixes.

My PC came with the 8GB 3060 TI fitted.
Ken

I think PhotoLab just sends command queues to GPU and VRAM management is done by the Nvidia driver and the encapsulating Microsoft code, memory usage being adaptive.

Yes, your right on Queue, and also in others. However, please see below.
Your comment give an idea (Many thanks!) to me to check as i can what happen.

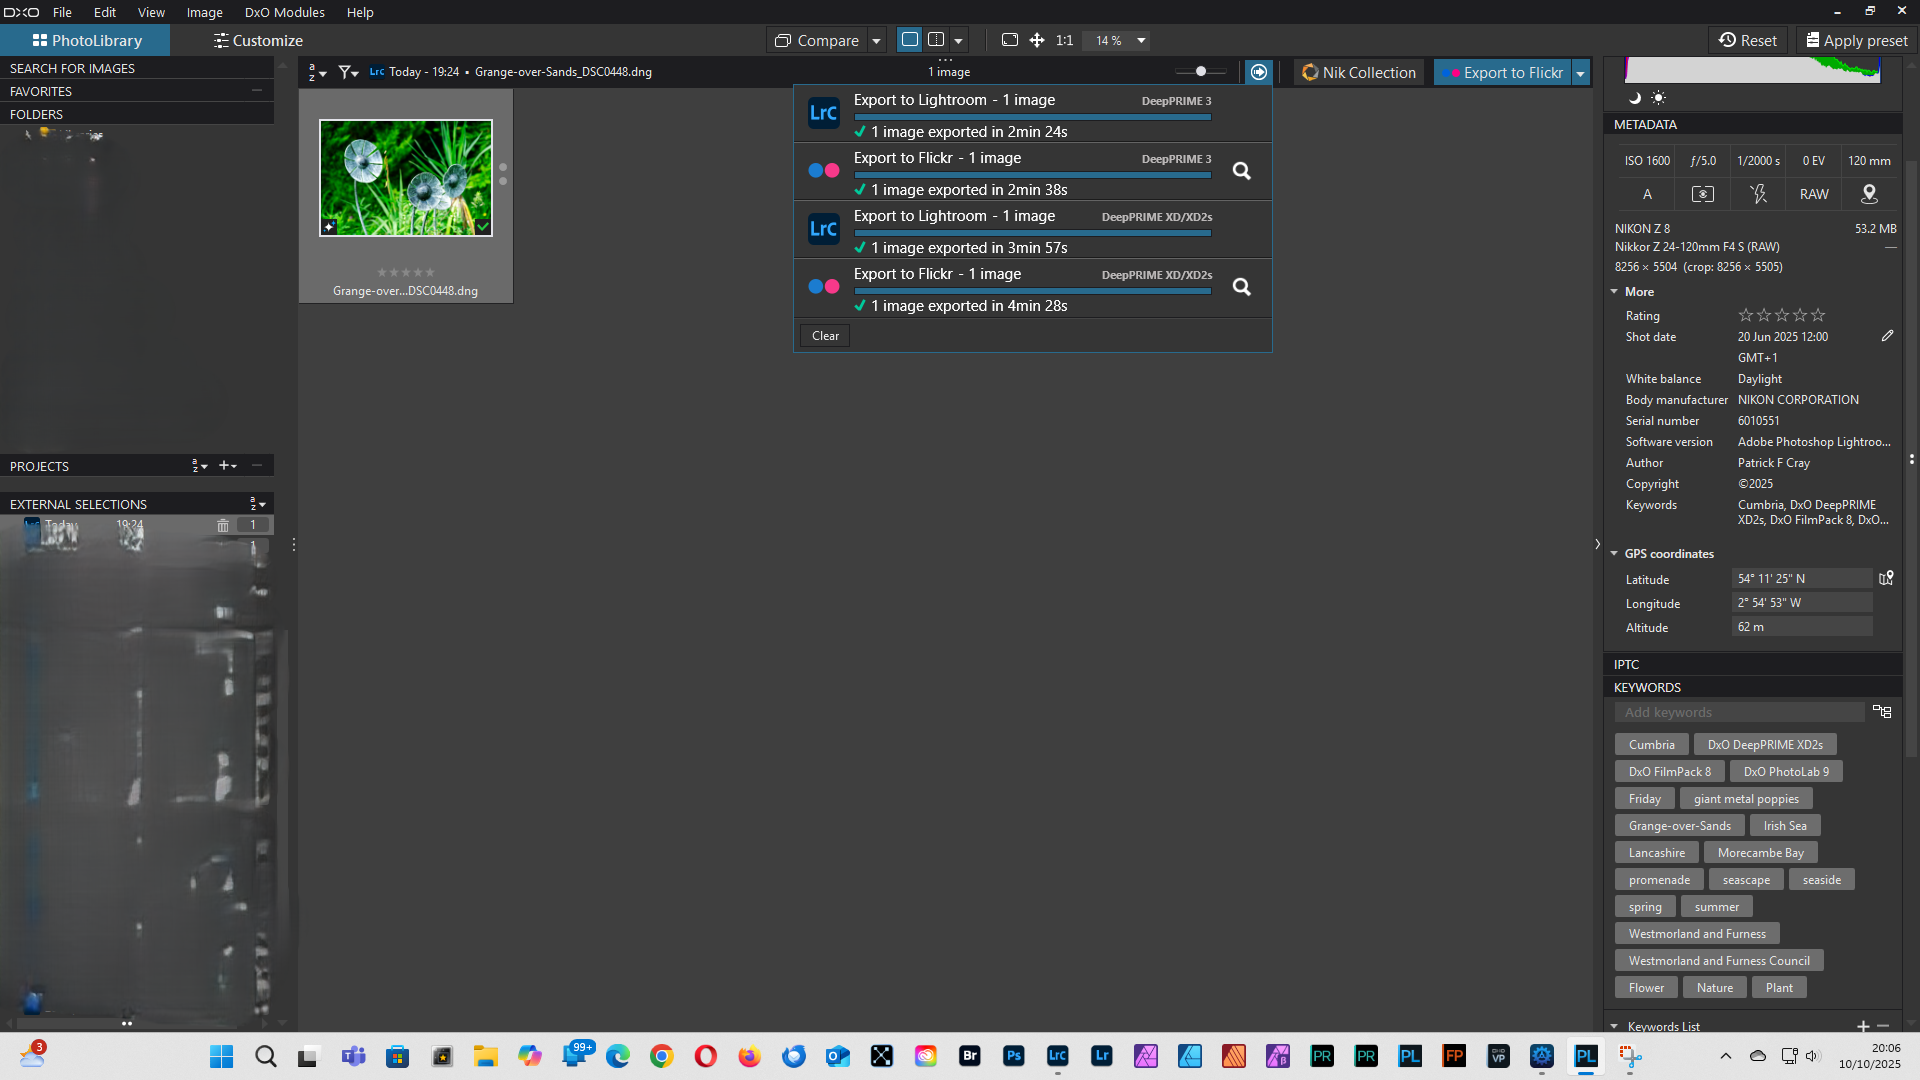
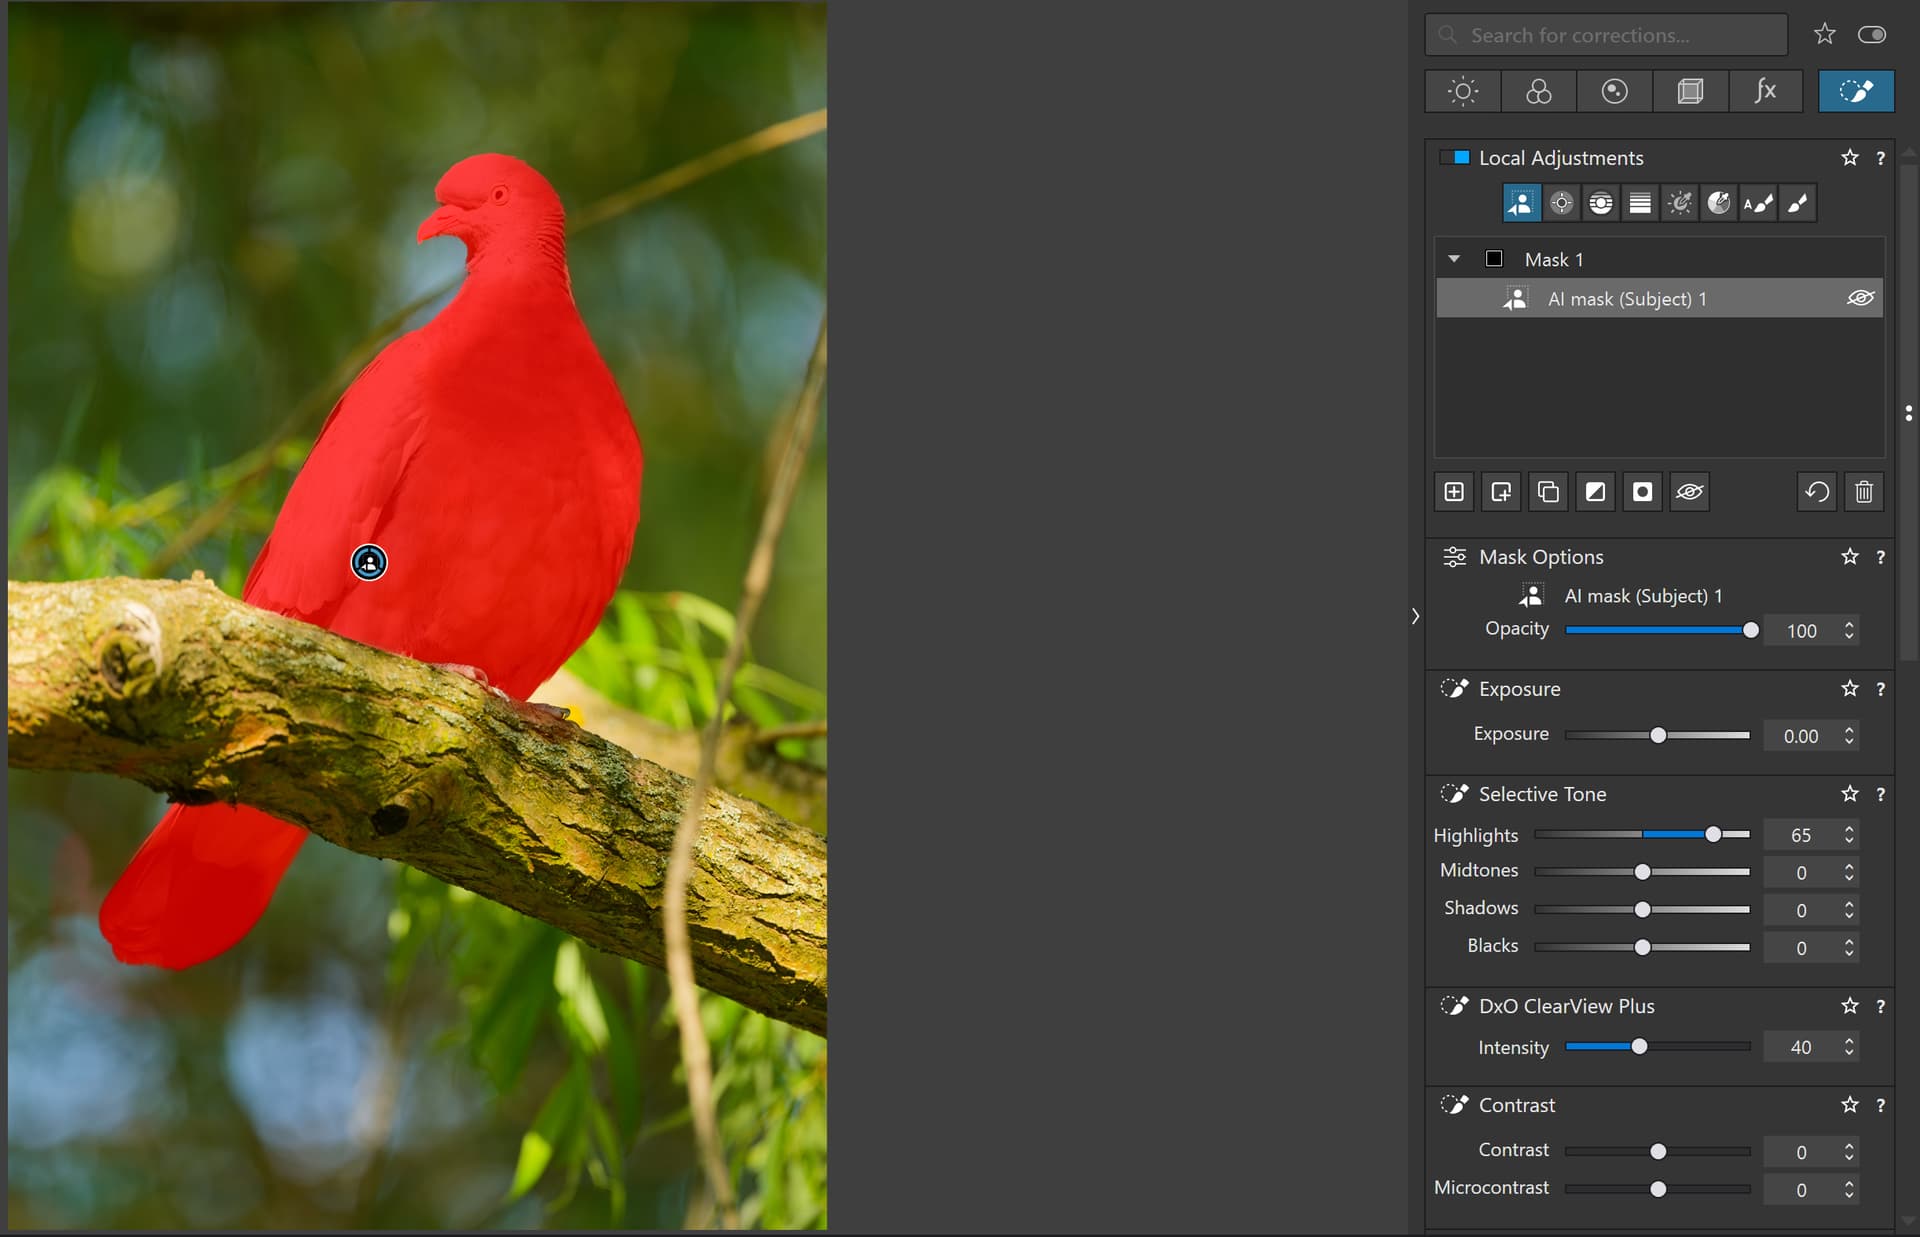
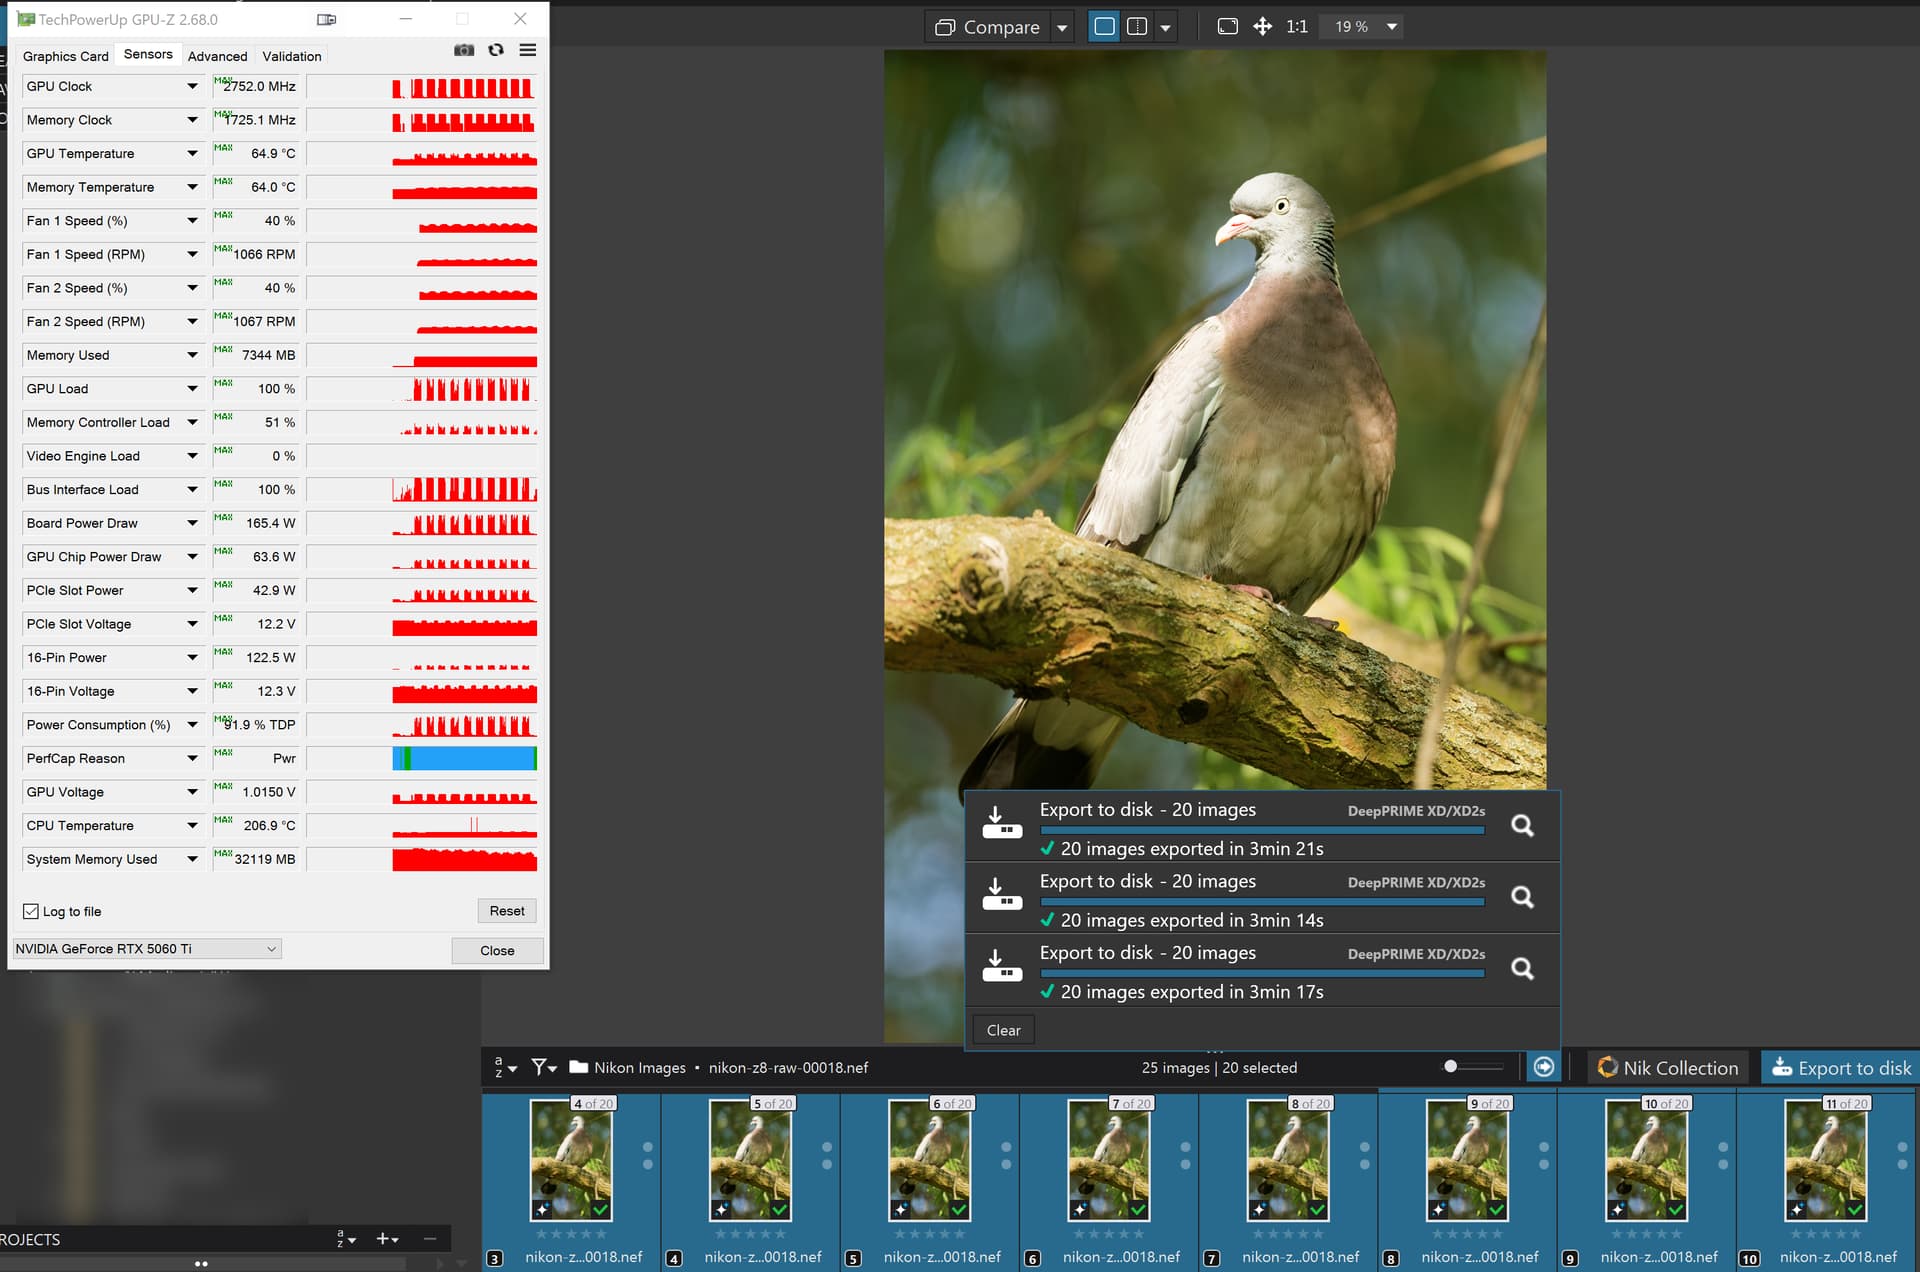
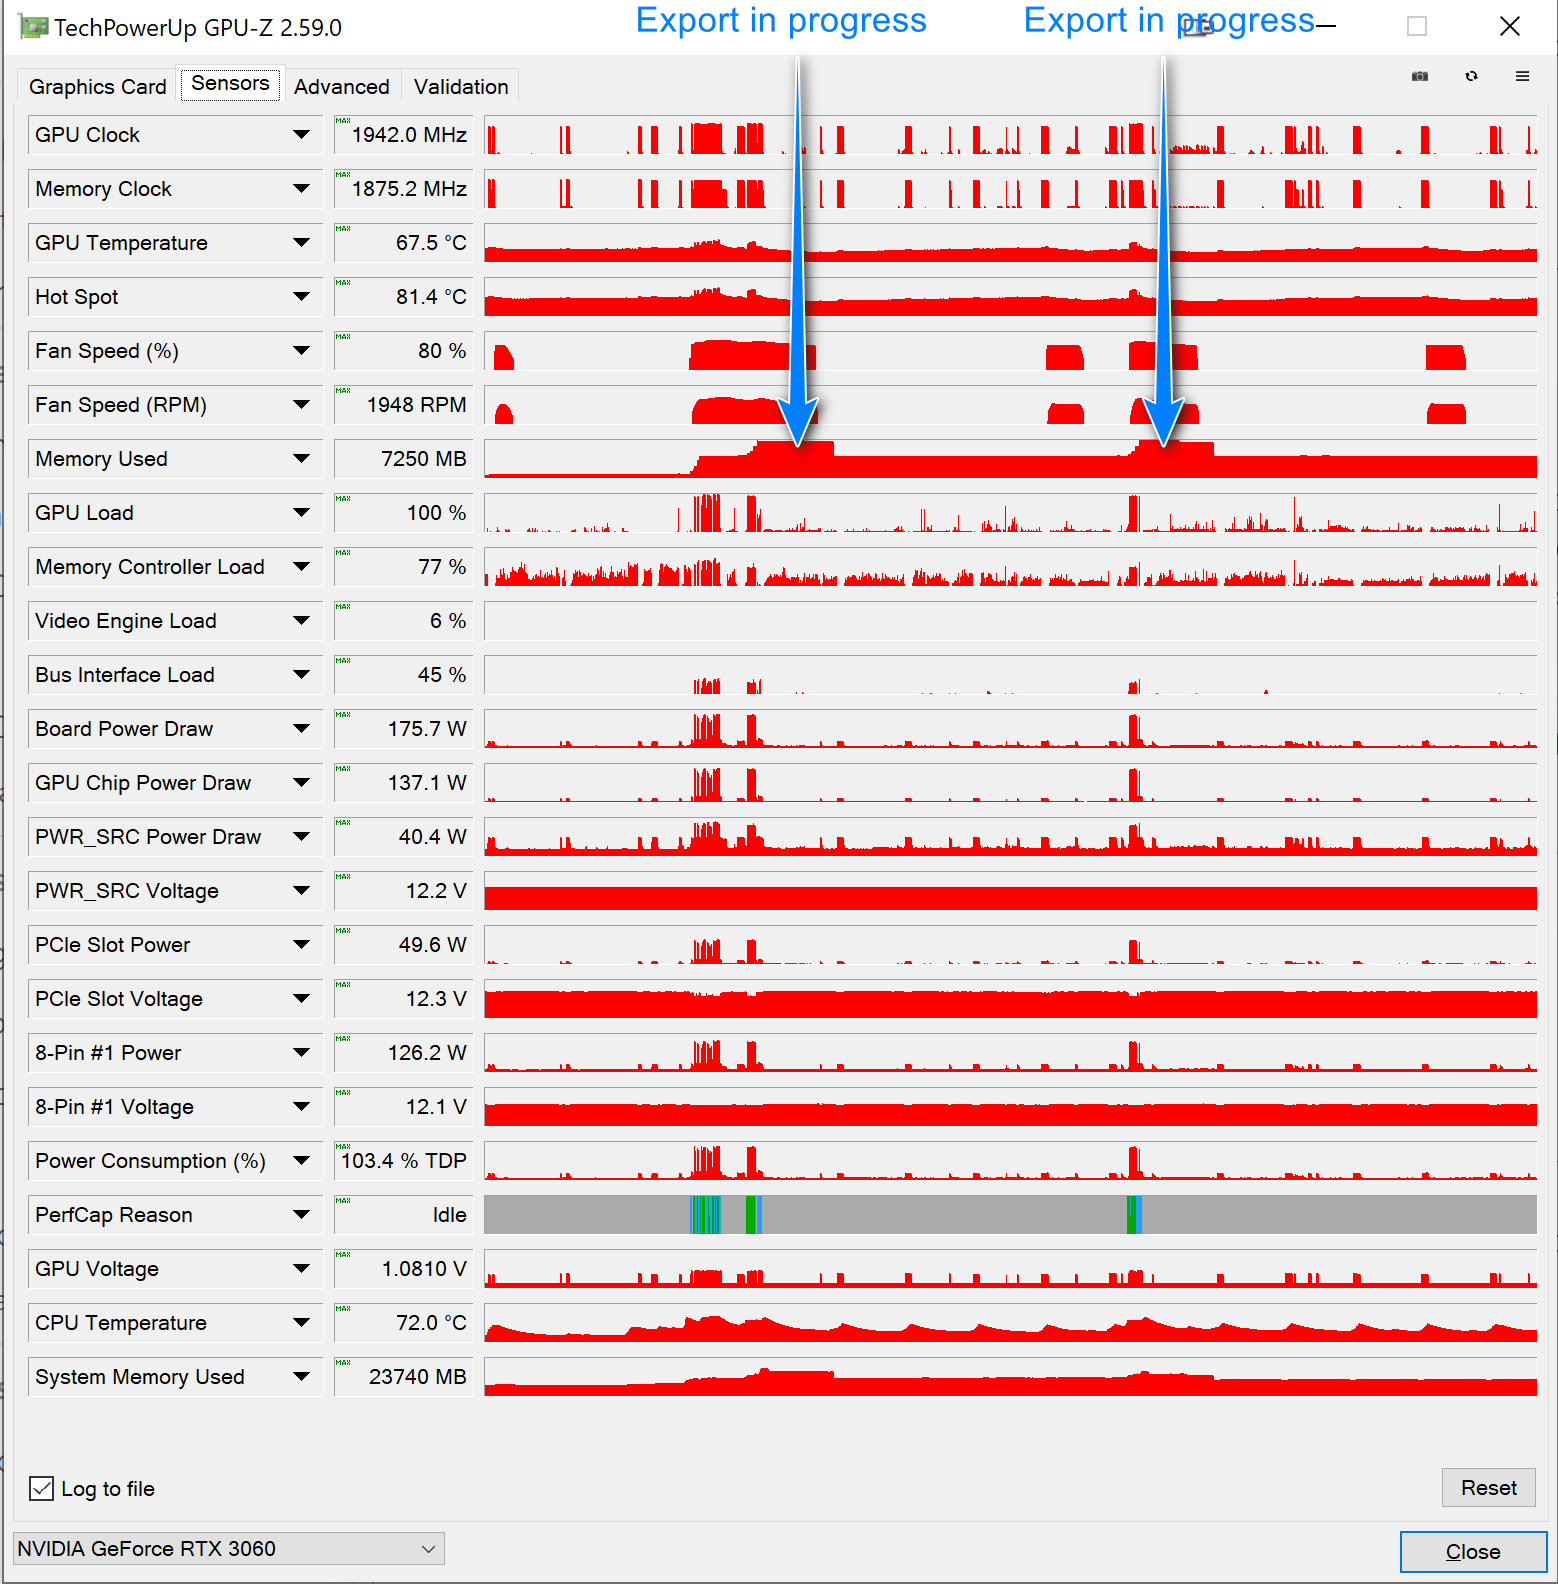
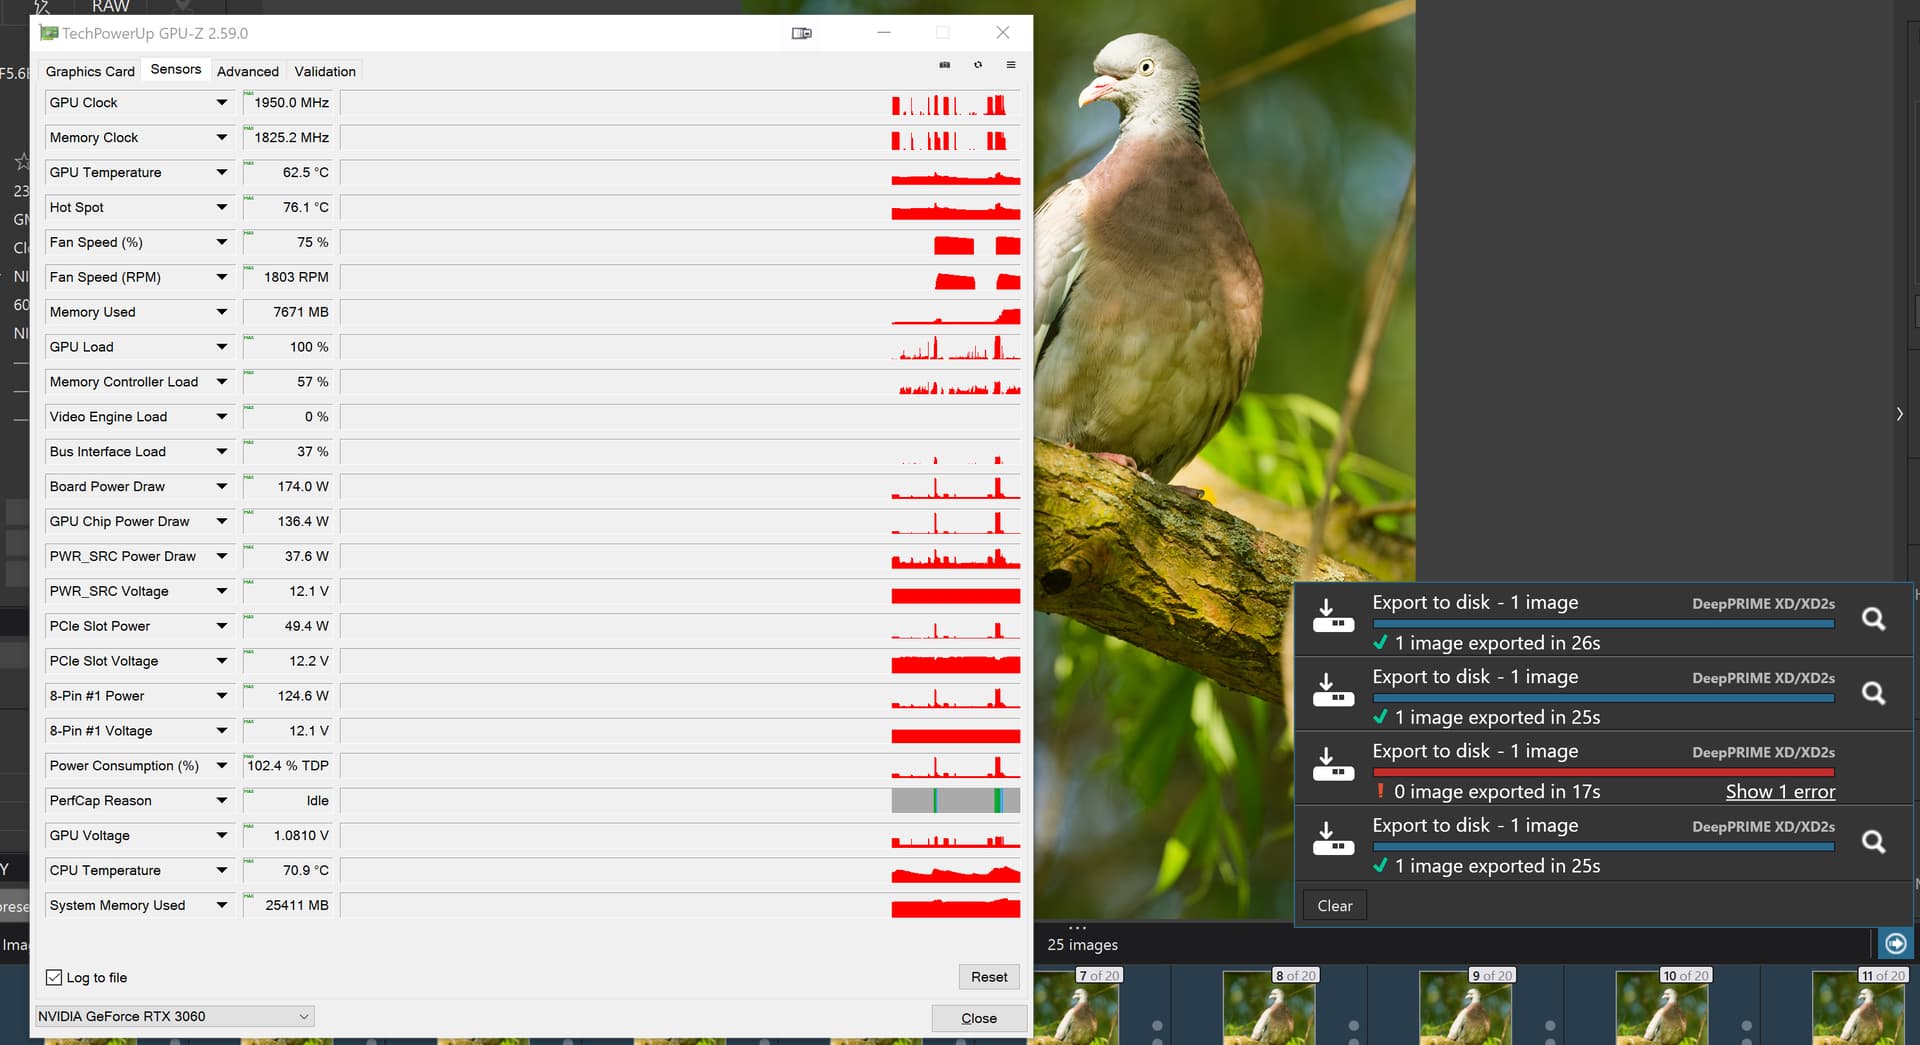
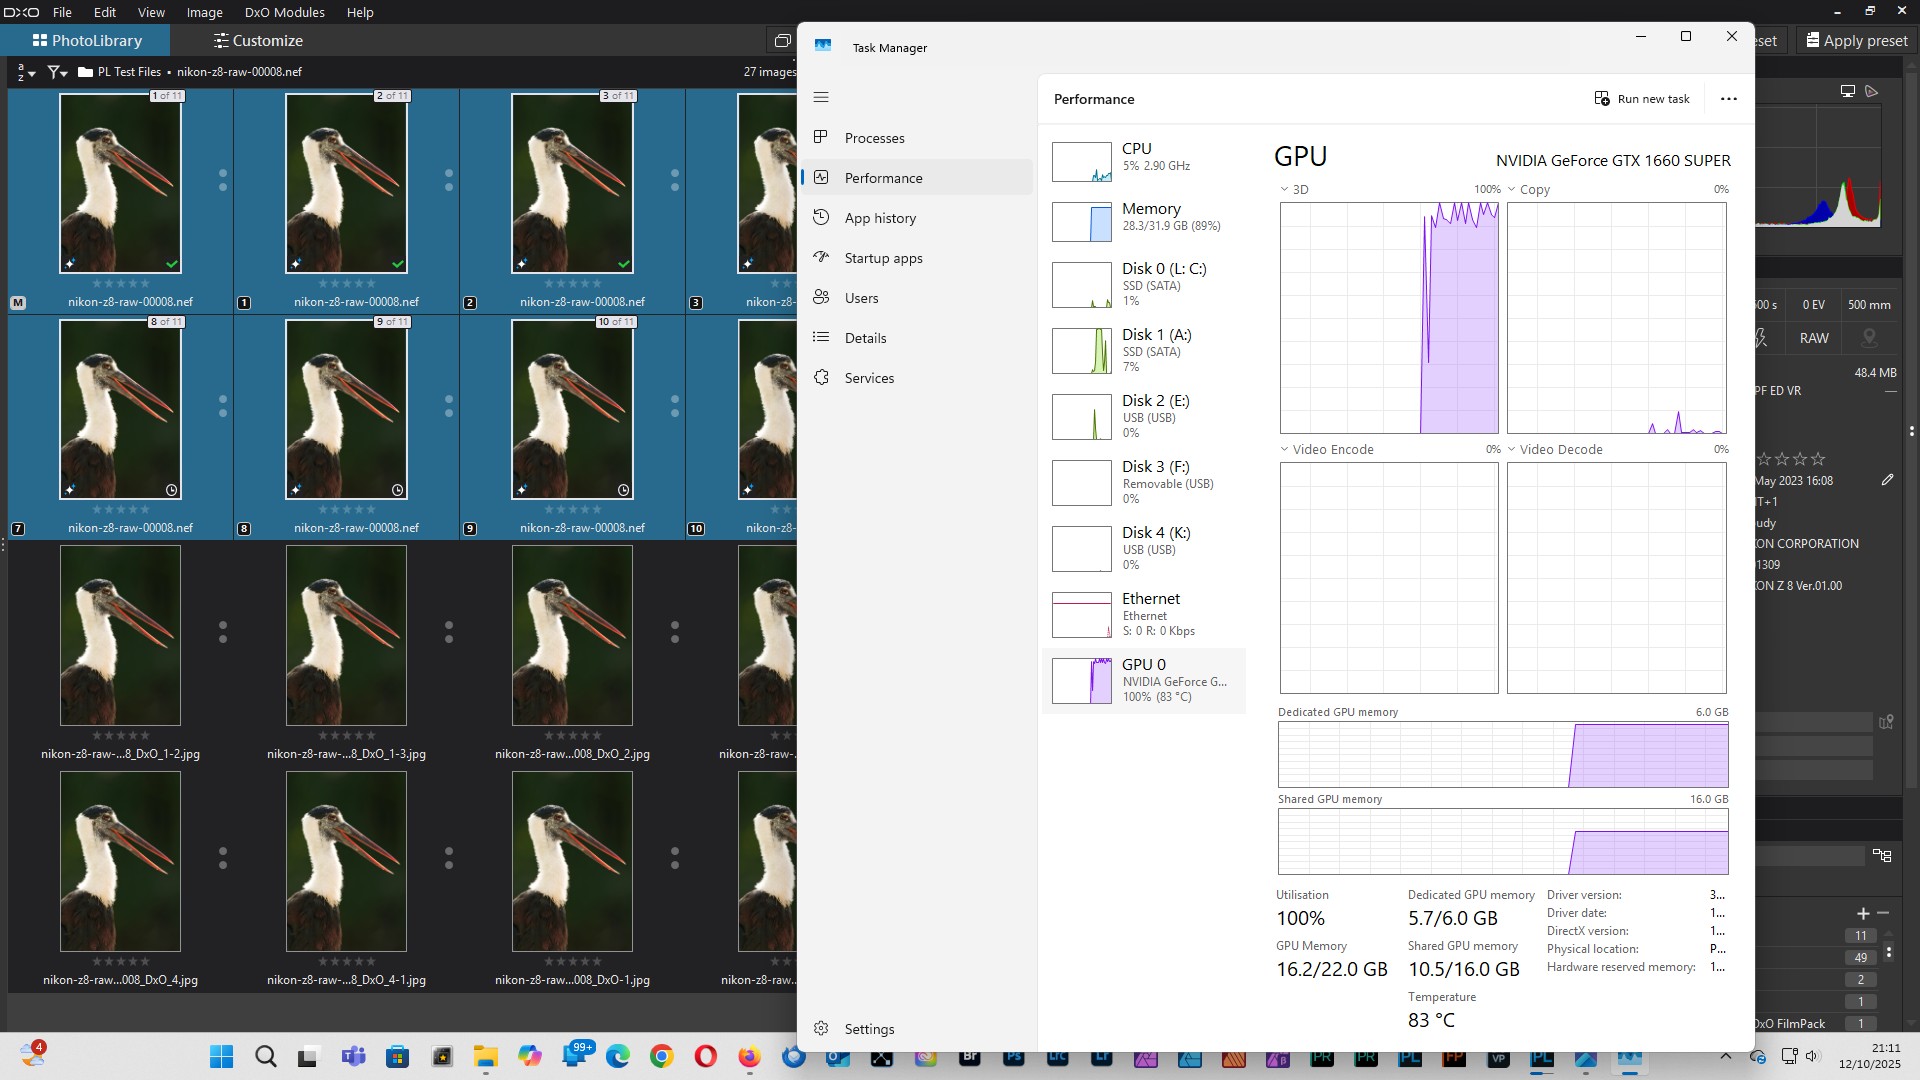
I check in one (1) photo DP3 export, no AI mask, GPU. Windows11.

UPDATE! Corrected memory measures + Export process GPU purge now know more!

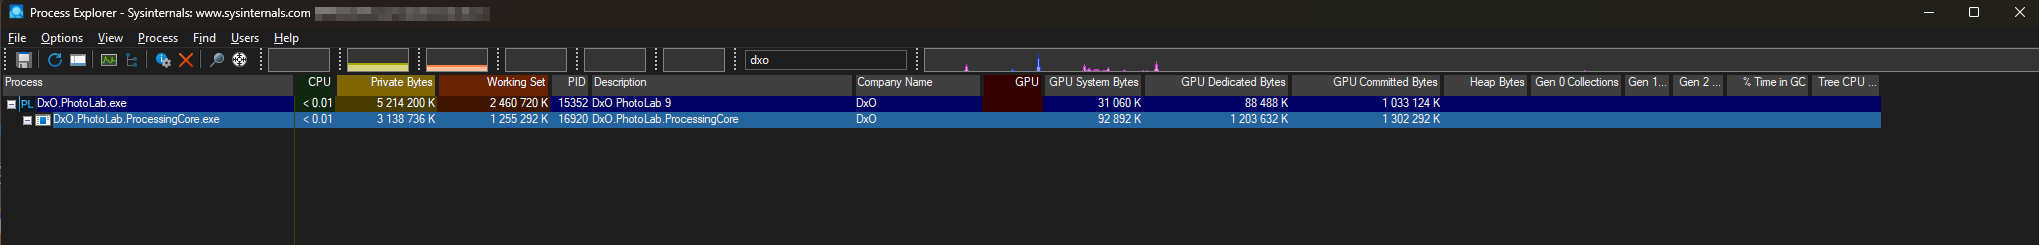
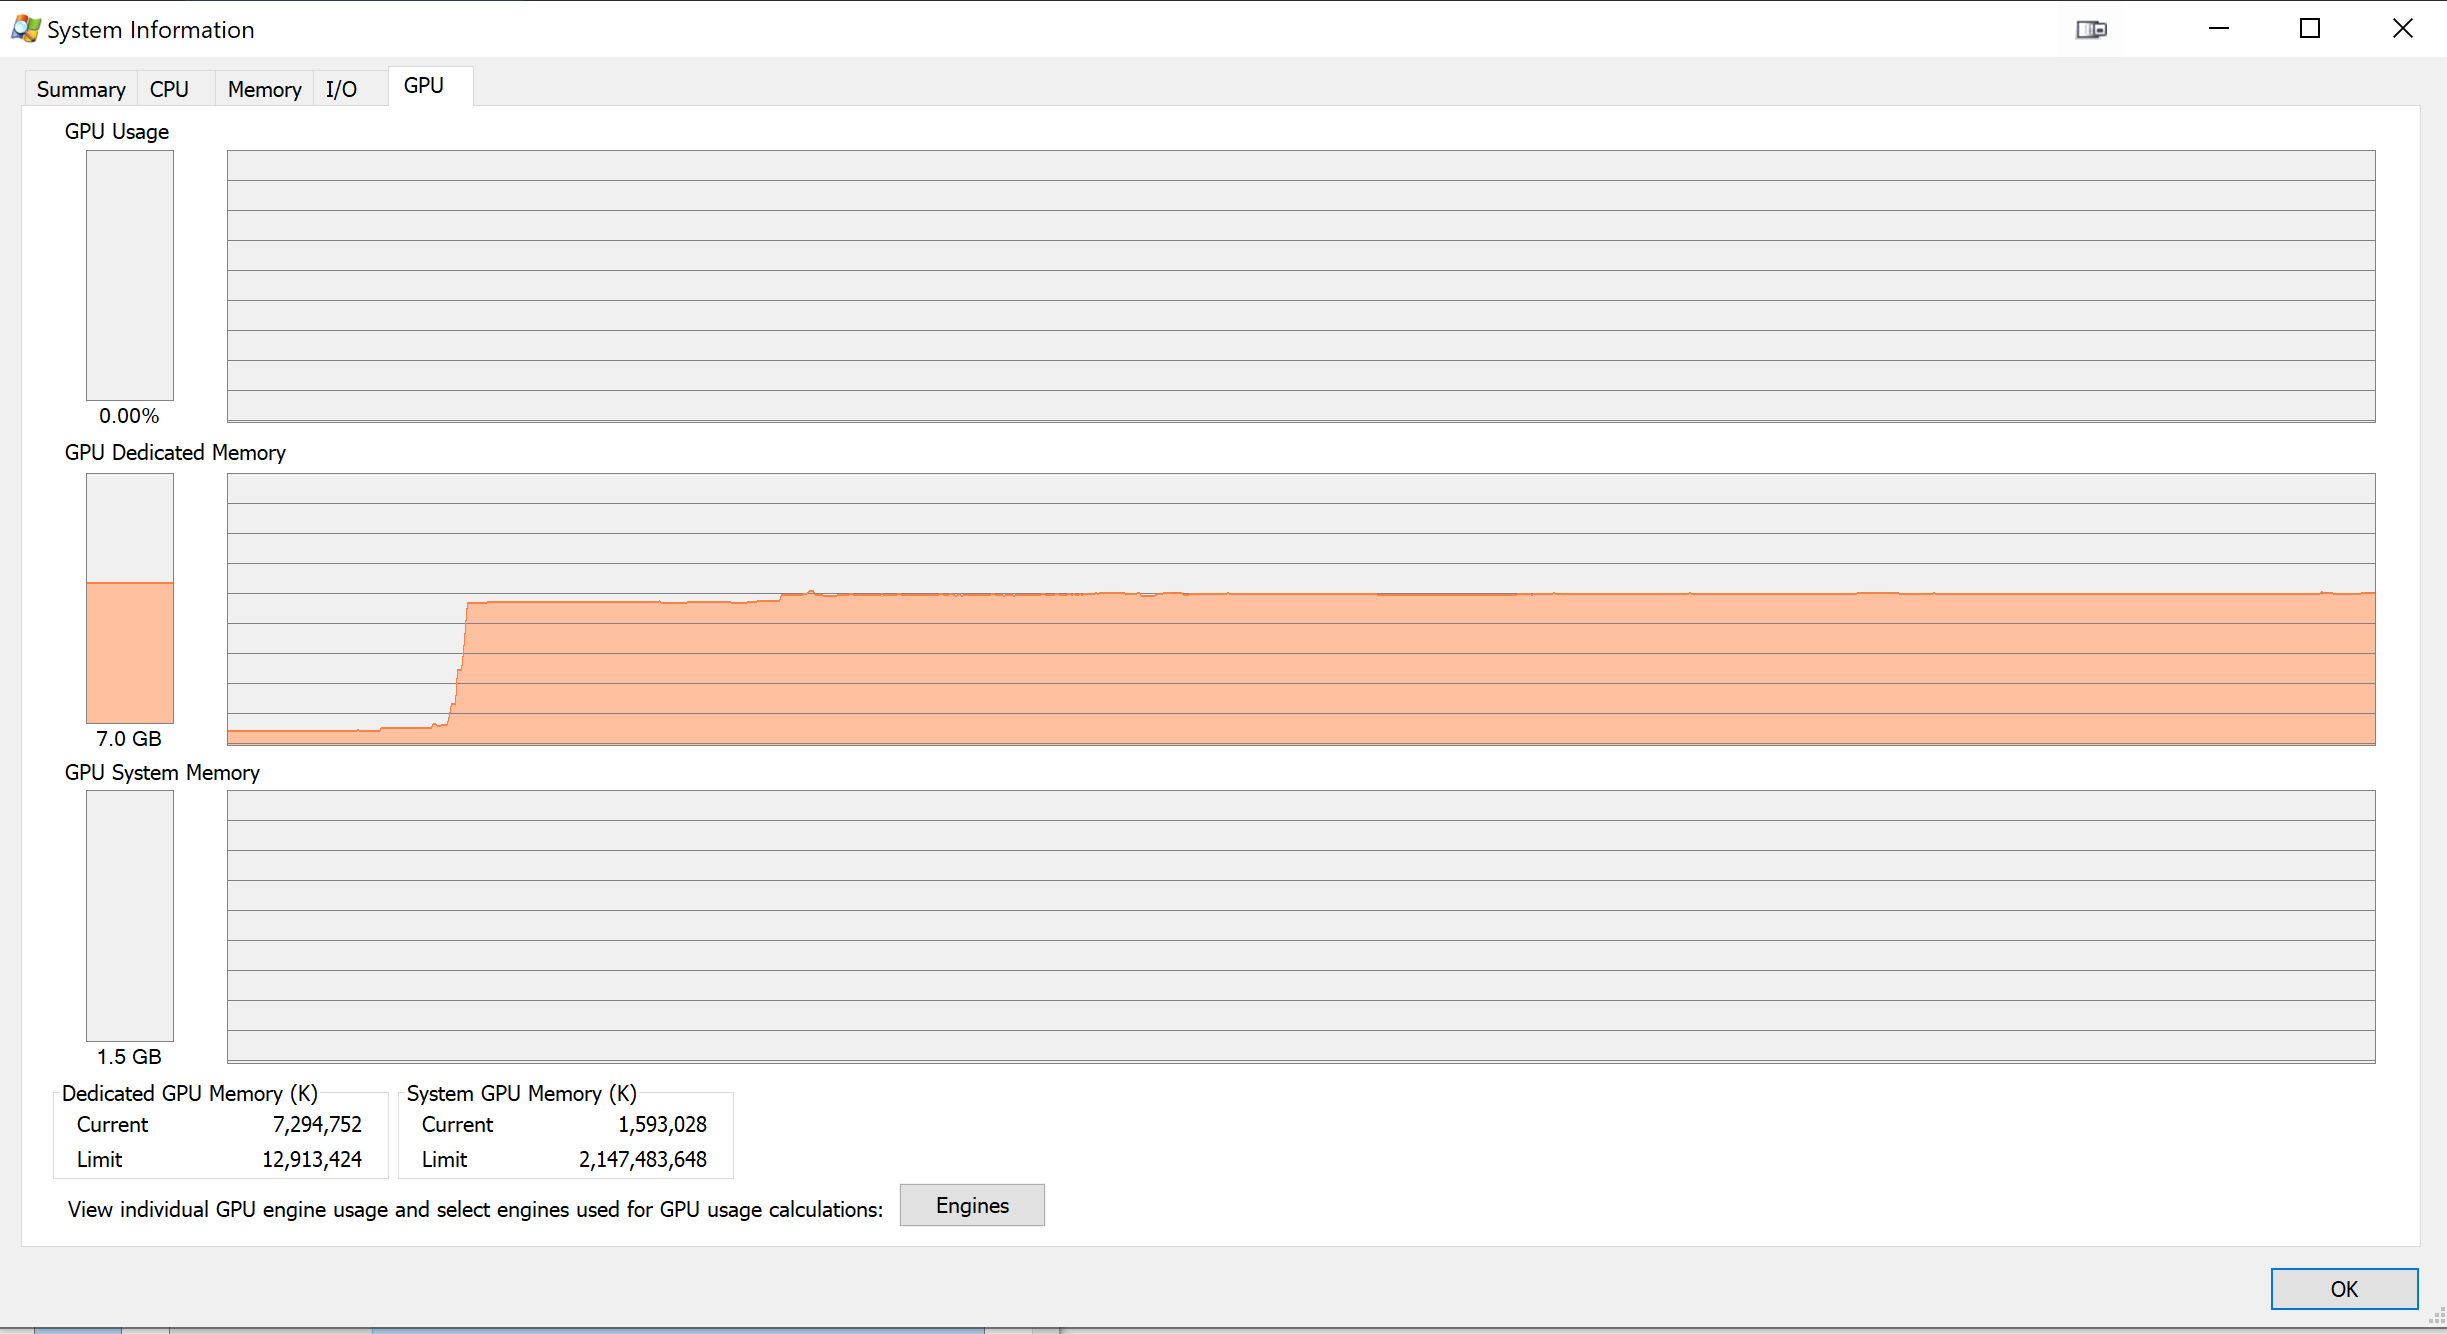
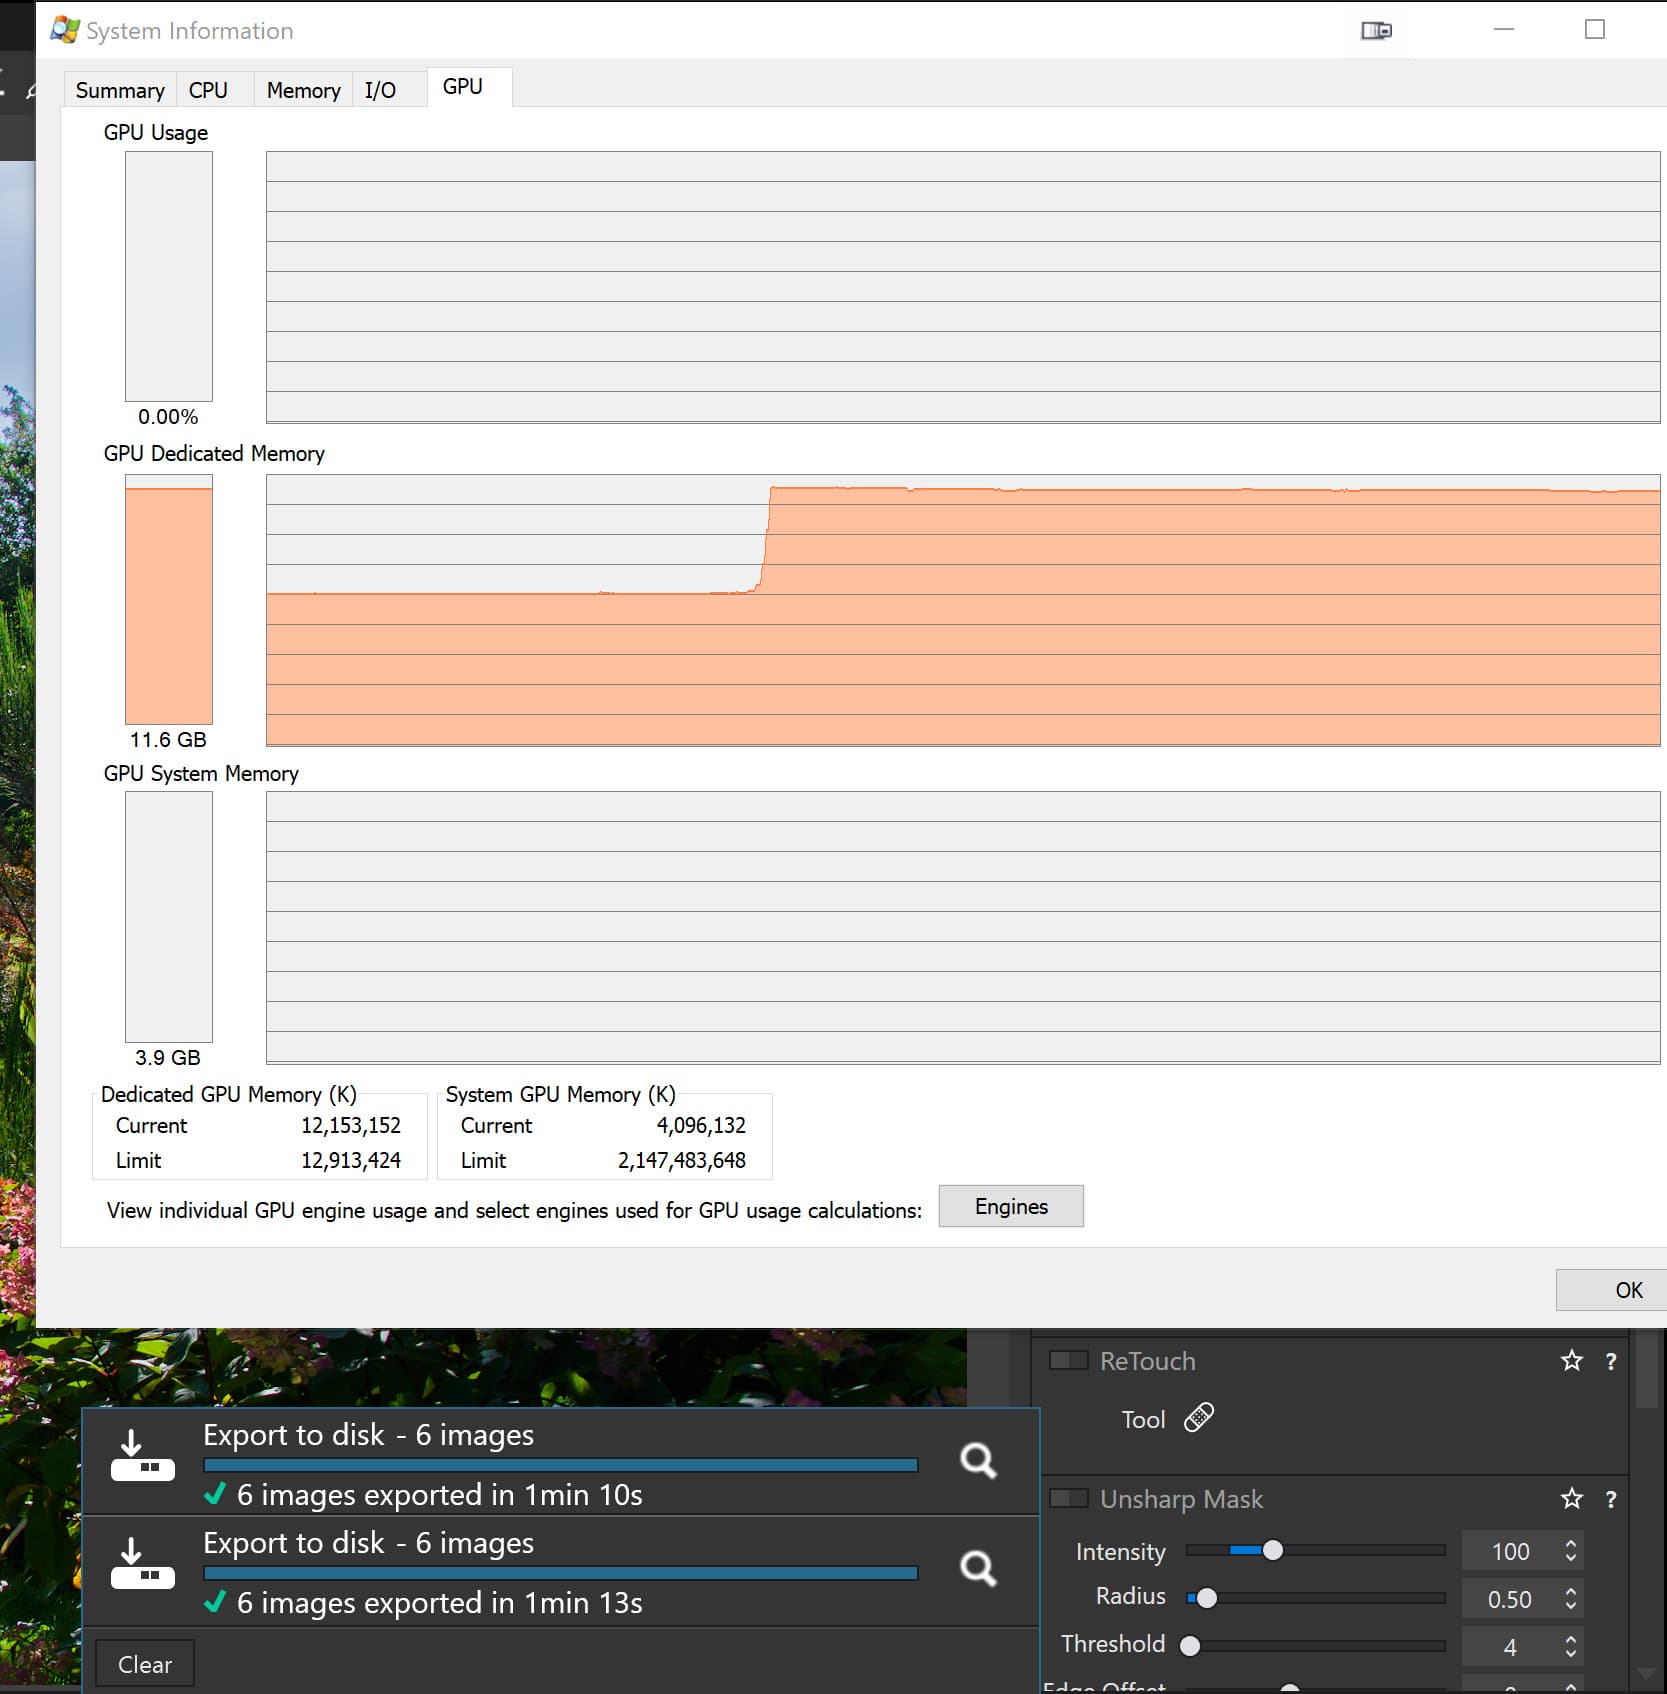
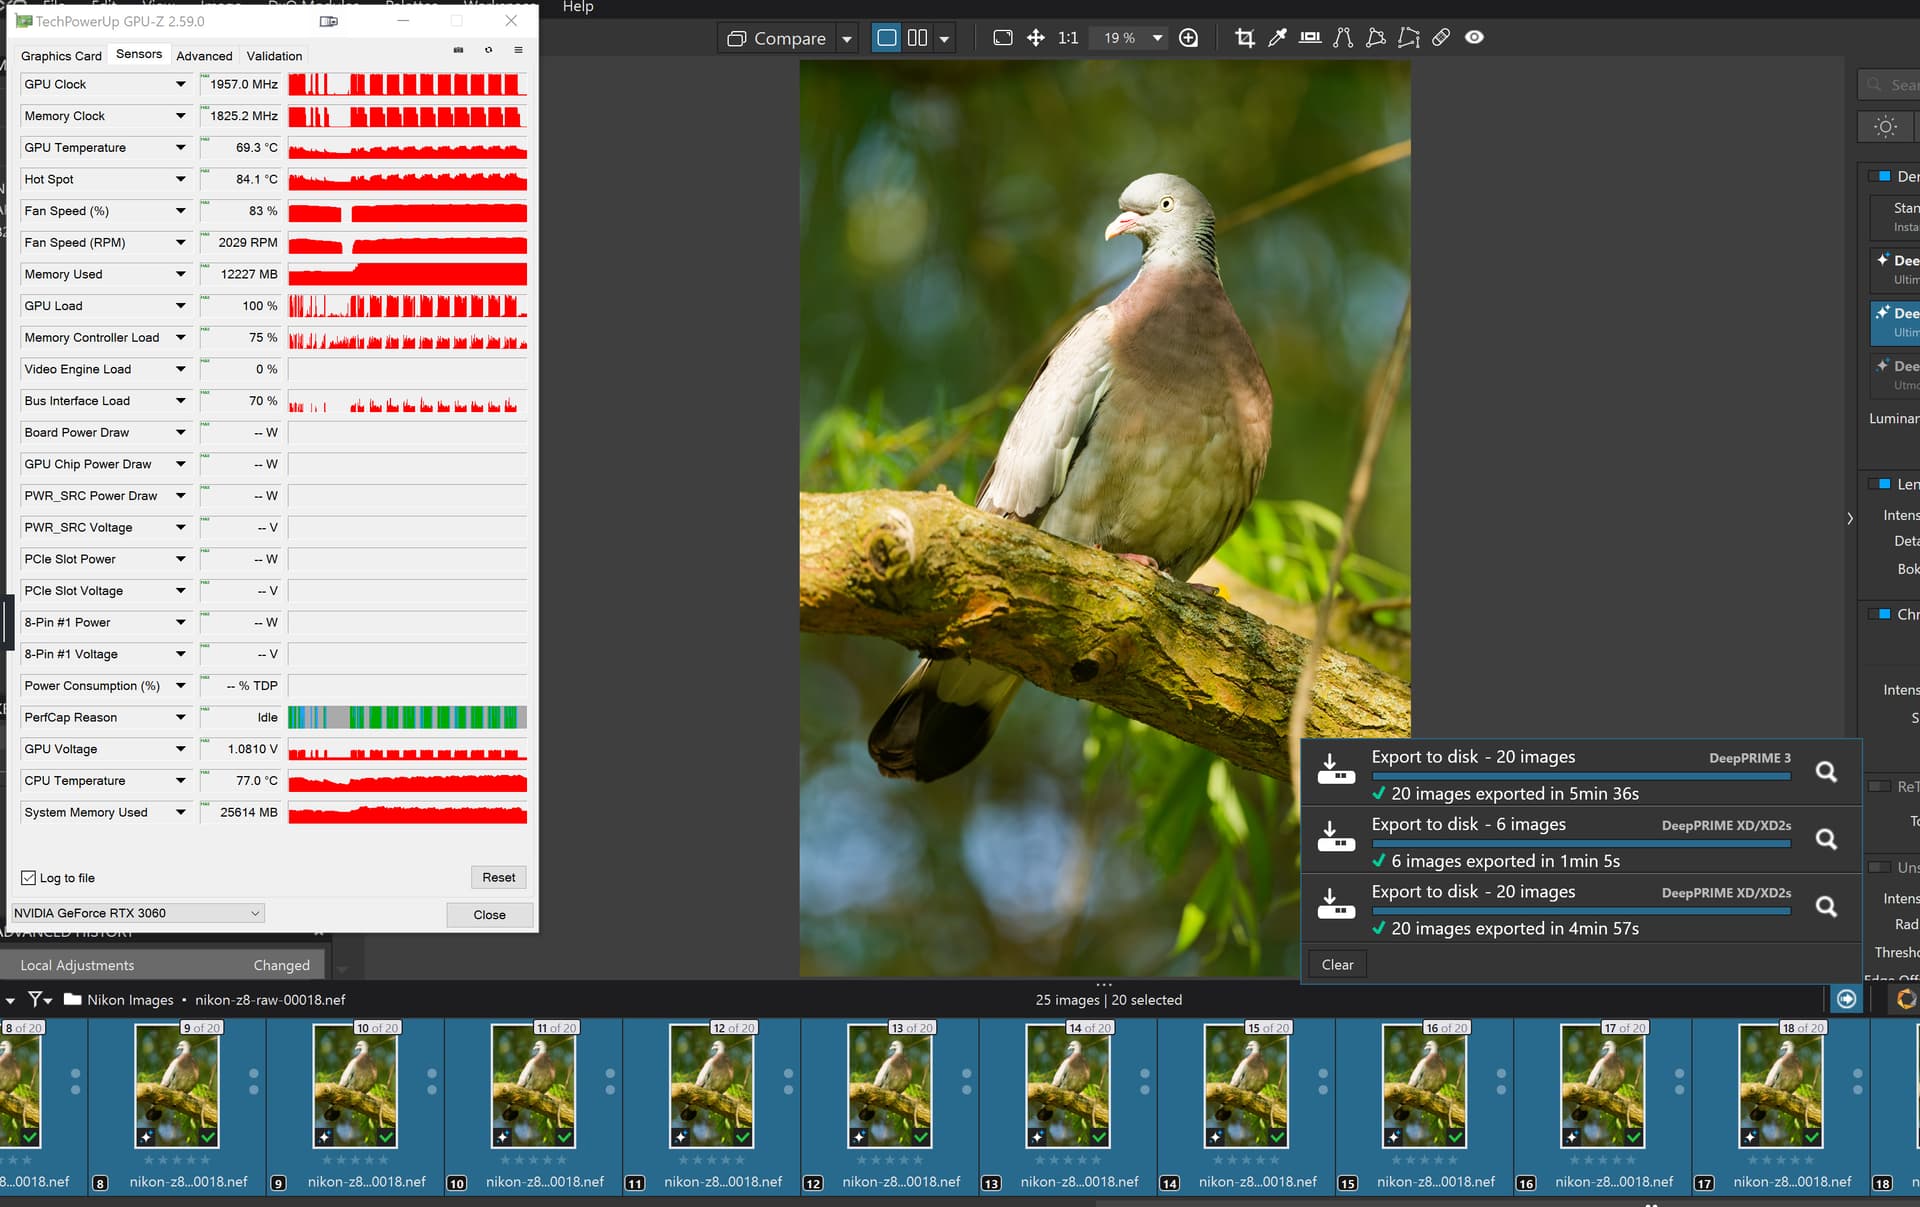
After export the GPU VRAM usage approx:

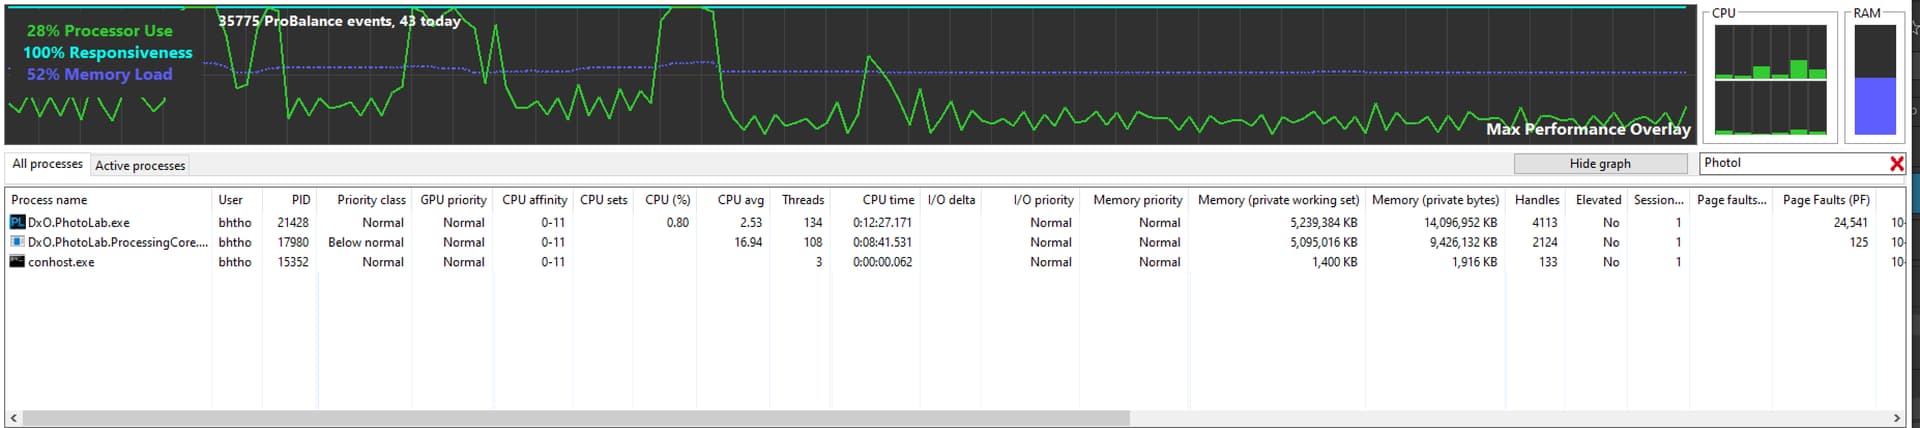
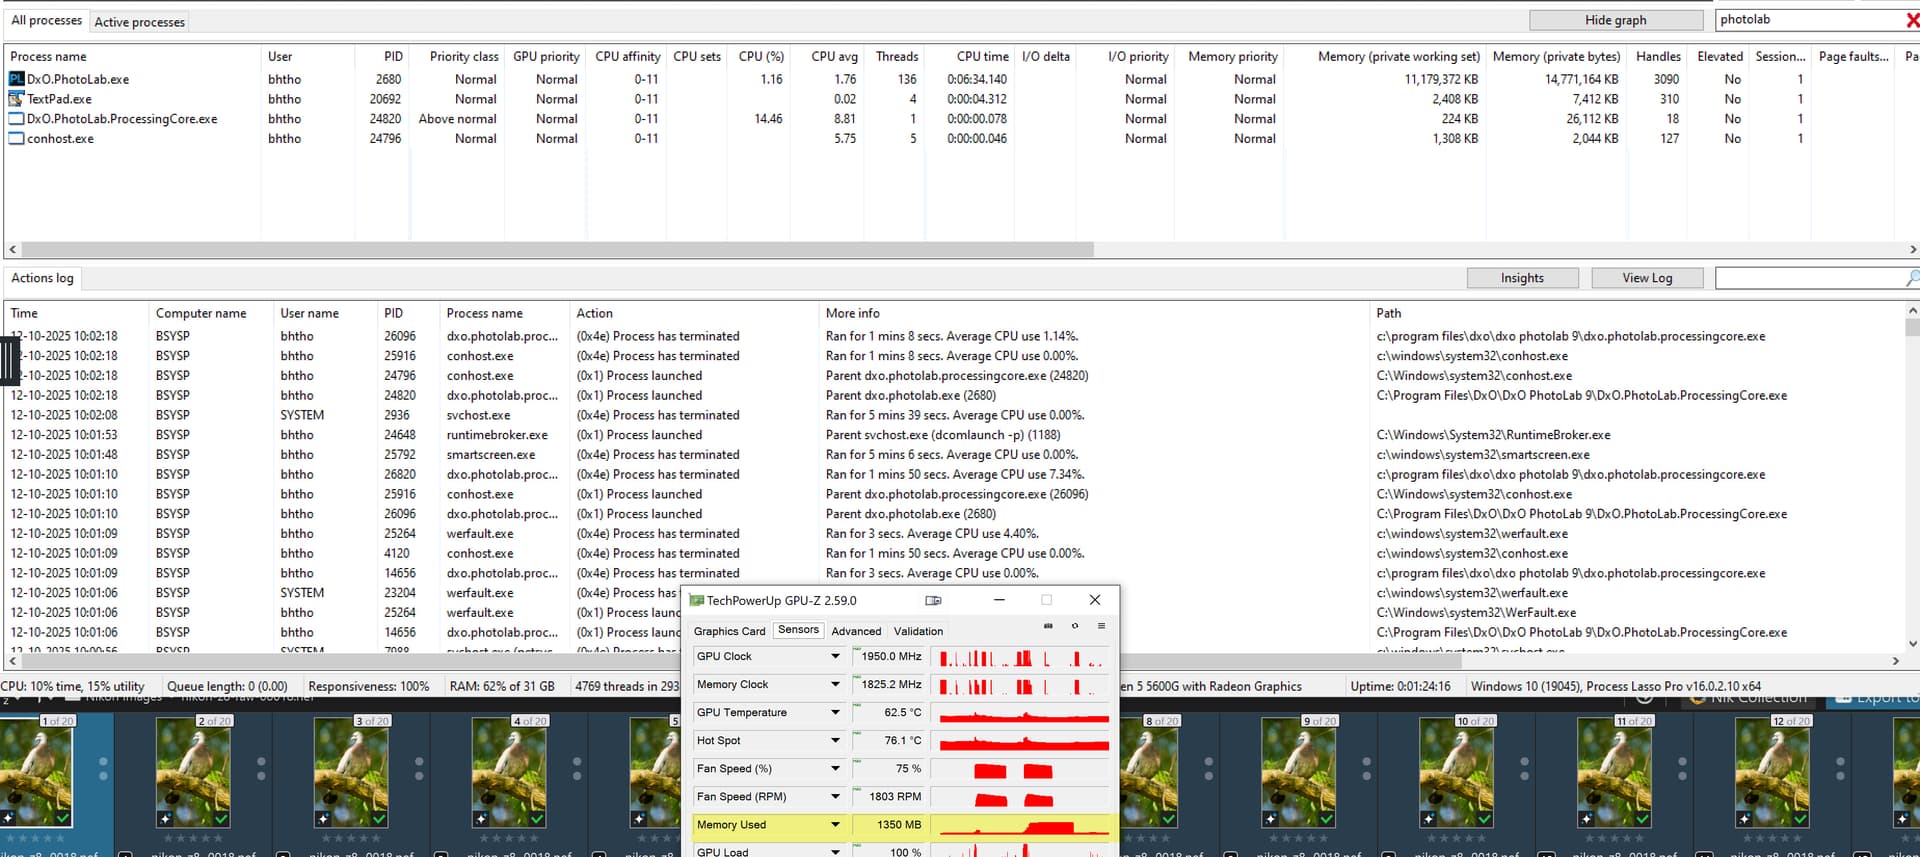
DxO.Photolab.exe → its the main client application: 0.7 GB (usually between 0.5-1.4GB)

DxO.PhotoLab.ProcessingCore.exe → Its does the Export processing: 1.3 GB

Overall - DxO Client + DxO Processing (export) is approx 2.0 GB

But after DP3 export, the Processing (export) ‘stay’ on 1.3GB (for a while, see later). What may seems pointless - at least may for most of us - but mays okay, see below.

Release ‘unused’ memory called ‘Garbage collection’ (GC) function (or some similar name). DxO Application use ‘Concurrent GC’ mode - what is pretty typical in client applications. But i guess its only for the ‘CPU Memory’ (standard memory) usage, and not for the GPU Memory - but seems also in GPU something happen.

I guessed the followings about PL GC on GPU (to release not used VRAM):

  1. Not works at all
  2. Works, but ‘memory purge’ time can be quite long - may if we wait a few hour, may see interesting things.
  3. Works, but its a ‘large object’, it’s never reach the GC limit for purging. - for user point of view its just not works

I do some test, and find out (at least for me) the point 2. Works, but ‘memory purge’ time can be quite long - may if we wait a few hour, may see interesting things. is the reality.
UPDATE: Not, seems its not do on Export GPU usage any GC, its use some pre-defined time (2hour)

After PL stay idle (no editing, no export, just stay minimized) for like 2 hour (i not check exactly) the PL GPU usage drop down - seems GPU GC ‘purging’ works, but its need time, seems hours.

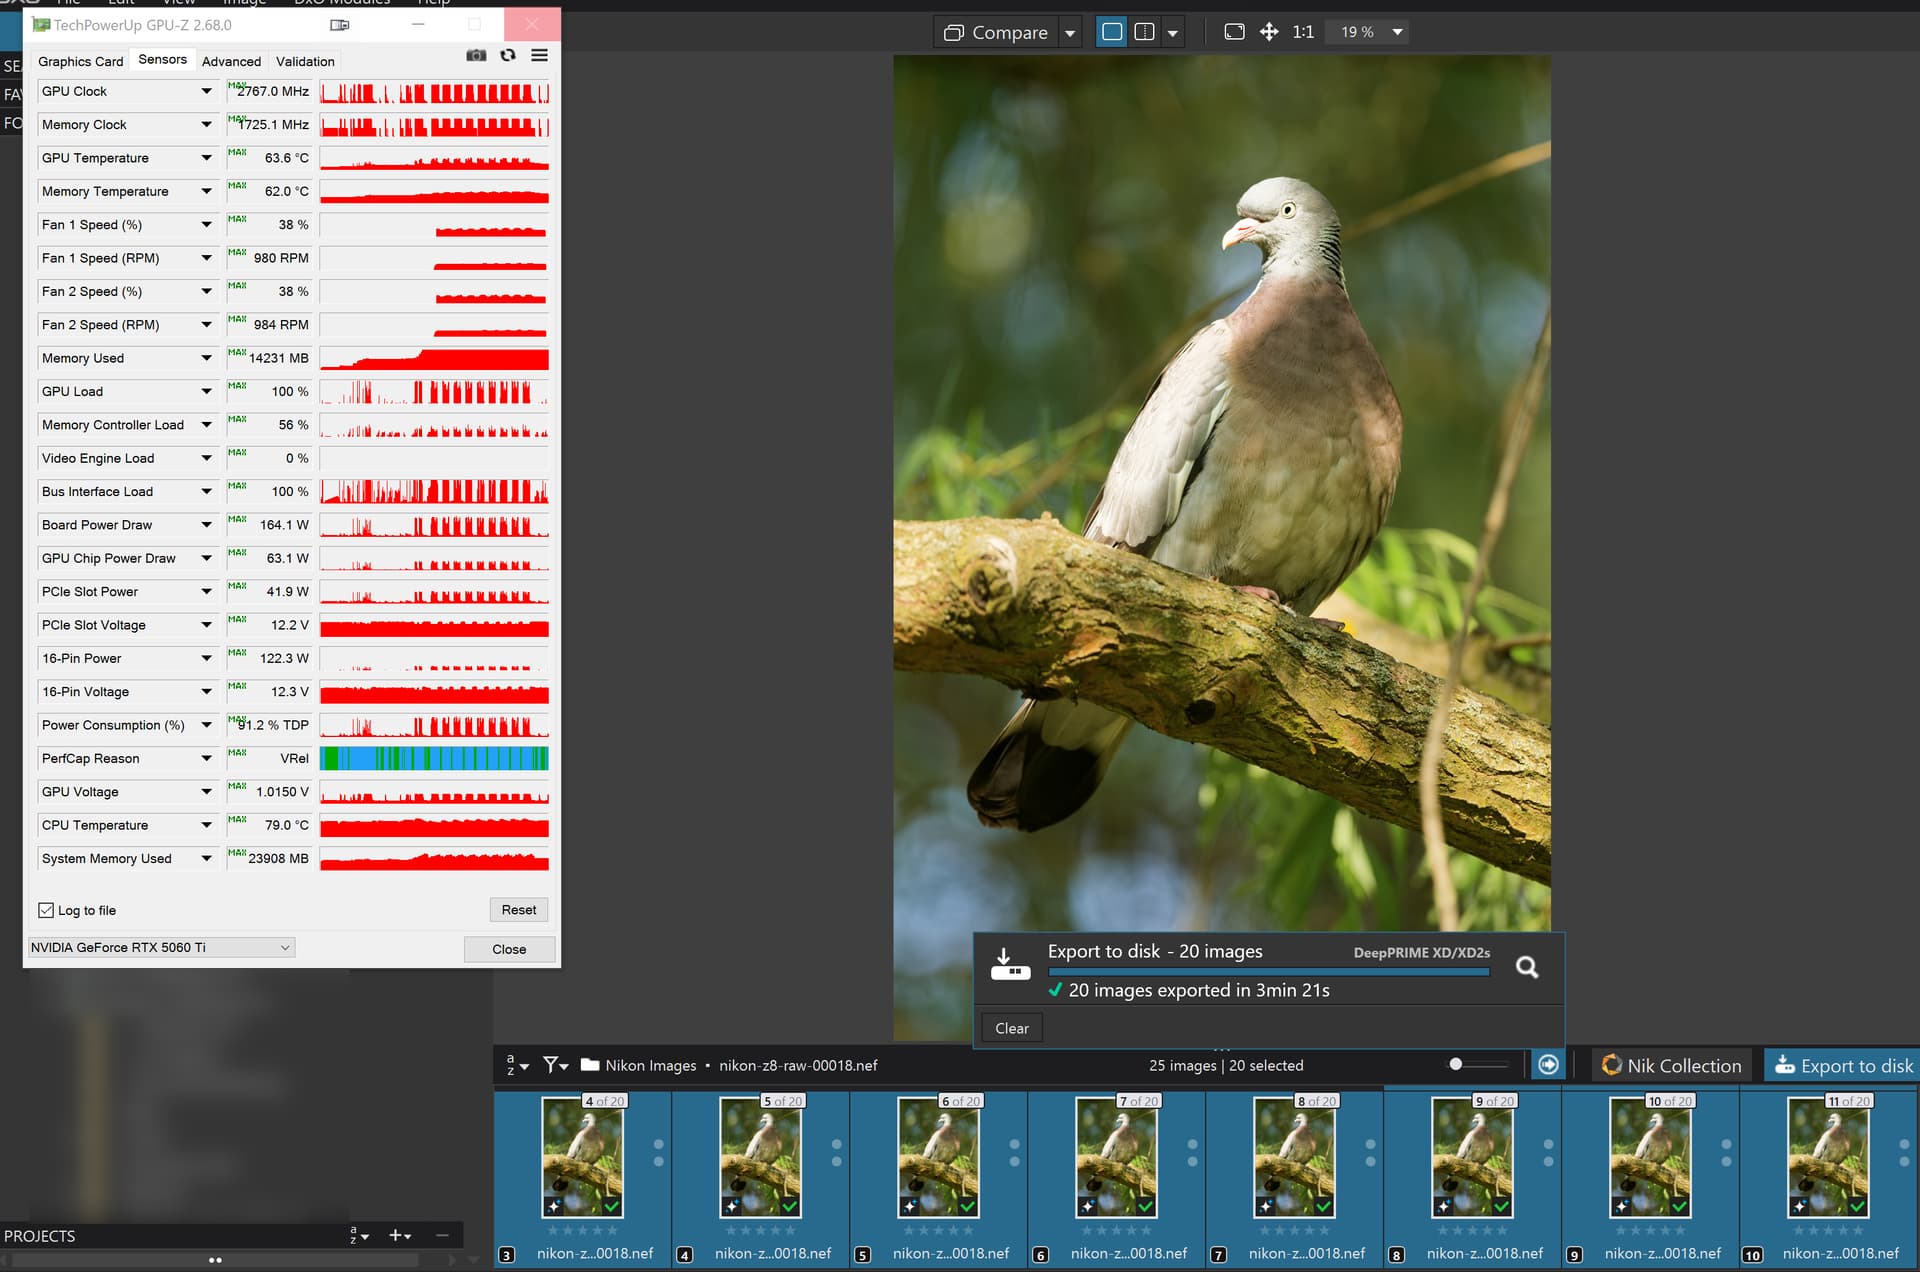
So, after like 2 hours of PL idle, i read the followings (GPU VRAM usage) approx:

DxO.Photolab.exe → its the main client application: 0.5 GB

DxO.PhotoLab.ProcessingCore.exe ->Its does the Export processing: 0.12 GB

So, DxO Client + DxO Processing is approx 0.7 GB (after PL is idle for like 2 hour). Export process definitely ‘purge’ unused GPU VRAM. - UPDATE: No, its not, see update in the end.

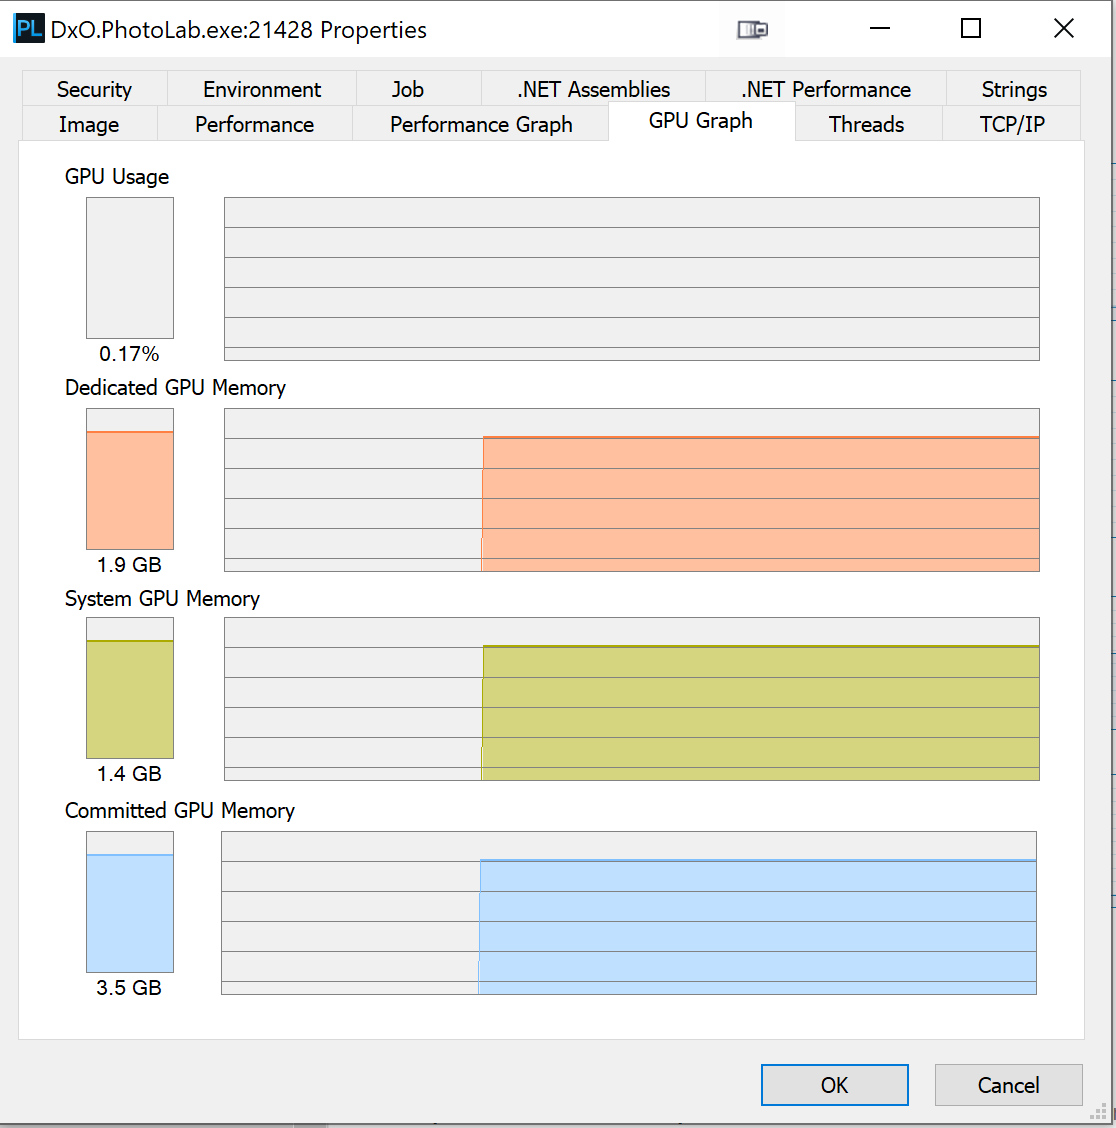
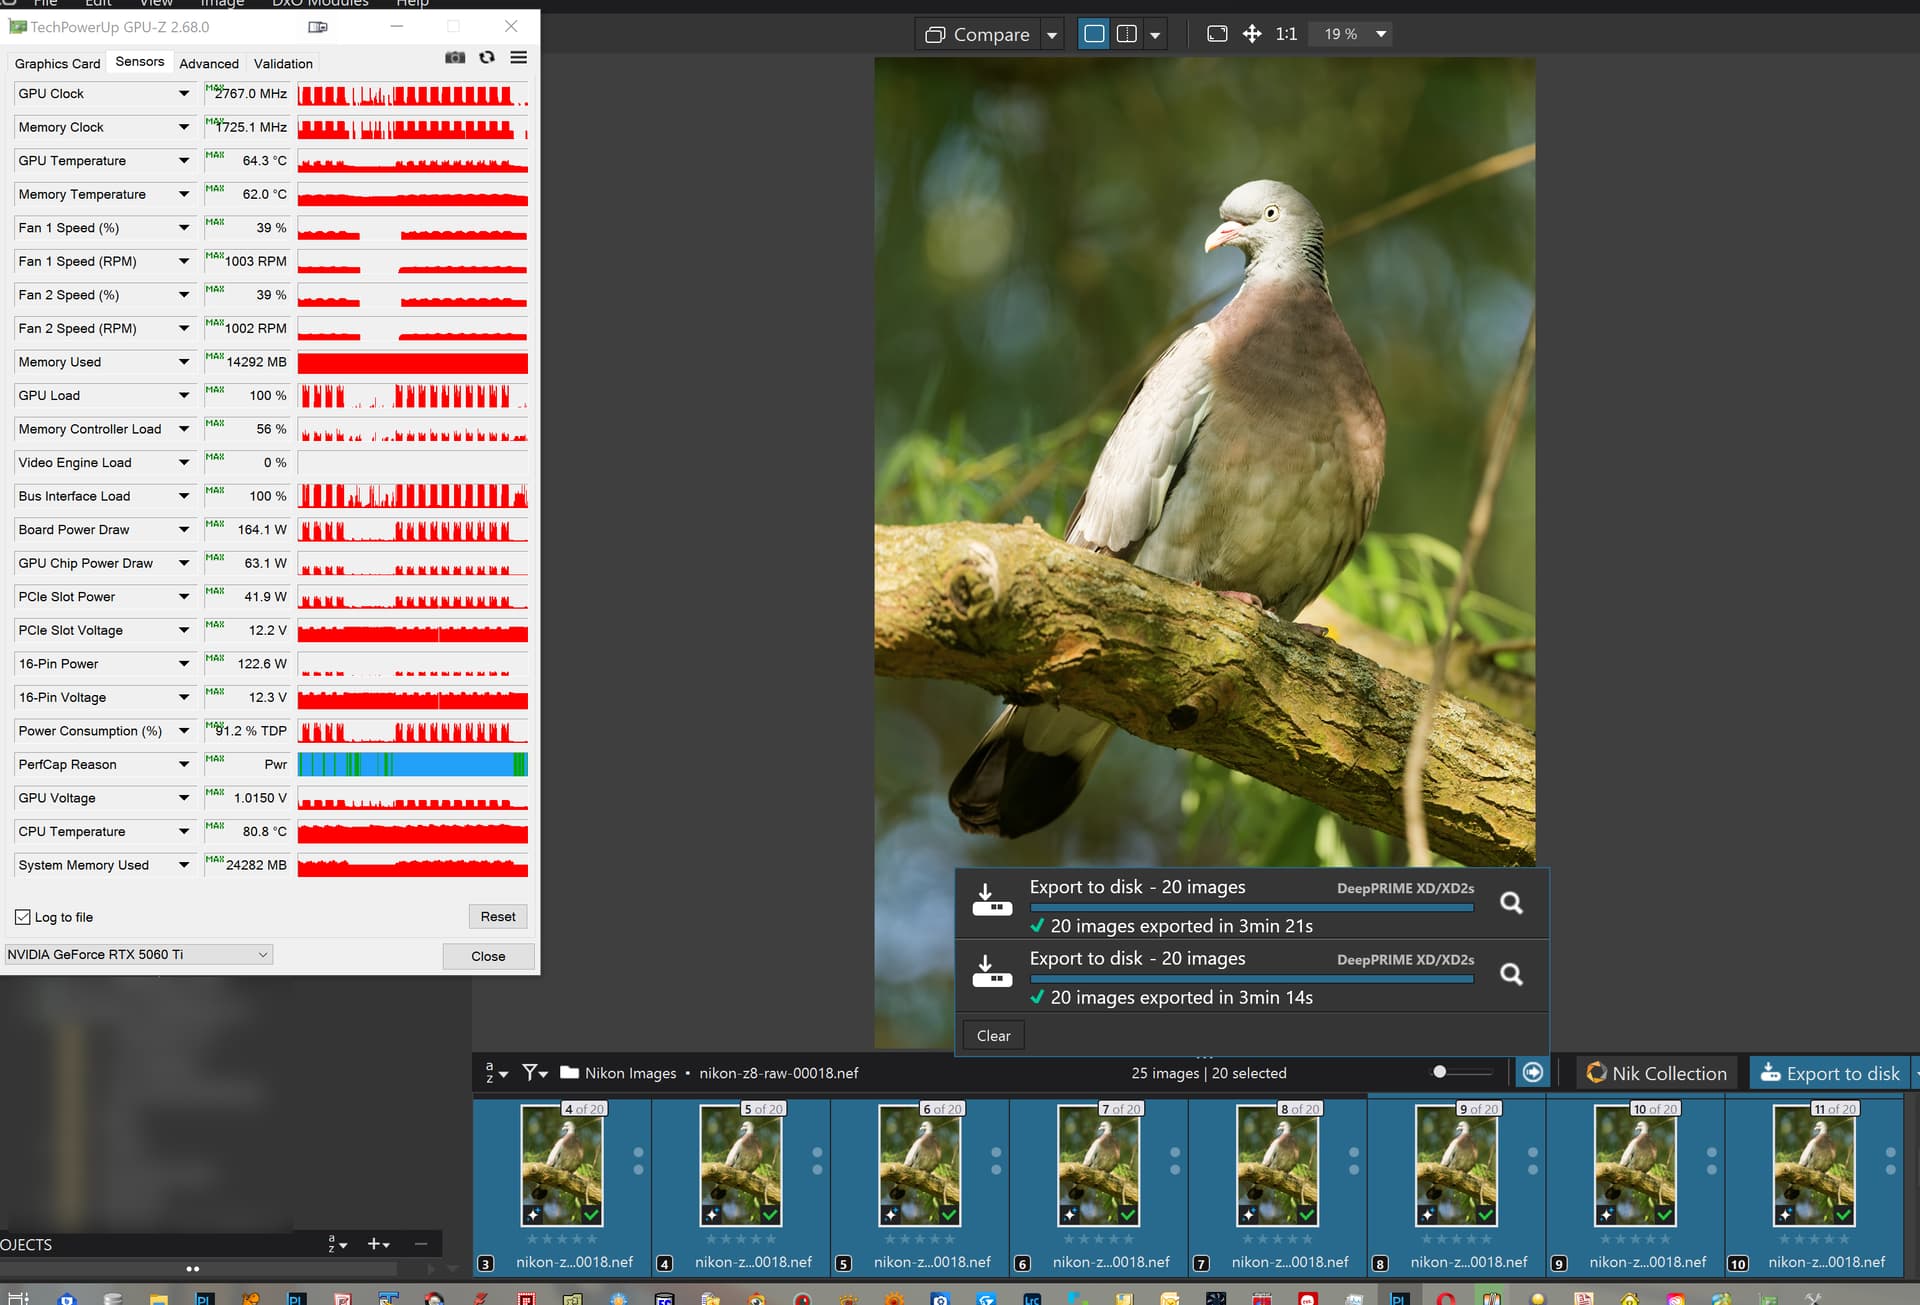
However, if i just click on PL, GPU memory change (what I expected) approx:

DxO.Photolab.exe → its the main client application: 1.2 GB (may a bit more)

DxO.PhotoLab.ProcessingCore.exe ->Its does the Export processing - stay in the same (what i also expect): 0.12 GB of GPU committed memory

So, DxO Client + DxO Processing is approx 1.3 GB

Overall i think:

  • If PL stay idle for a while (like 2 hour)
  • Seems not used GPU VRAM ‘purged’ (GC)
  • Both for Export process and PL main (client) process
  • Even if you continue PL editing (but not exporting), the Export process GPU VRAM usage stay in minimum.
  • May ‘we’ expect some more aggressive ‘memory purging’.
  • Seems memory purging done automatically, but as export process (DP3) result is pretty large object, purging happen after a quite while (seems stage 2 GC) - Update: no, its not purge via GC, its happen after a pre-defined time (2hour)

Disclaimer: it based only in my observations, and my computer (4GB VRAM, old AMD). May Export process purge memory even if you continue editing in PL but not export anything.

Sorry if it was too technical.

Add-on: after export kill the DxO.PhotoLab.ProcessingCore.exe also does the trick. Its automatically restart

@BHAYT - may you interested on this.

I’m not sure I understand.

Never heard of ‘GPU committed memory’. What do you mean by that? How did you get the number? Maybe you mean CPU memory address space shared with GPU (BAR1 in Nvidia terms)?
Note that in WDDM mode nvidia-smi doesn’t report per process GPU memory usage, since it’s handled by Microsoft’s KDM.

On Windows, when you start an Export for the first time during PL session, by default two DxO.PhotoLab.ProcessingCore.exe processes are created to handle the export (see number of export threads in Preferences). Their initialization is costly and may take several seconds even on fast machine. That’s why after export completes, these processes remain active and are terminated only on PL shutdown or expiry of idle timeout, which is 7200 sec = 2 hours by default. This is an undocumented parameter in DxO’s “private” installation directory, so better don’t touch it, unless explicitely told to do so by DxO support.

I got one of InternalErrors related to GPU just after starting PL9.1 and zooming the selected image (the one that was selected on previous PL shutdown), which was treated with AI mask. However, I couldn’t reproduce the error next time, so some timing is also important. Fixing will take at least several months, I think, as it seems NVIDIA is busy now with fixing MFG issues.

1 Like

I use Process Explorer (link - Microsoft) to get some more detail. Very little app.
Example screenshot. Processes filtered down to DxO. See GPU memory columns.

So great to see, your knowledge and my observations match on that! Wowww, that’s nice! Yes, the param does the thing, i try and true.

so better don’t touch it, unless explicitely told to do so by DxO support.

I change it, and also change few others. No worries.

Their initialization is costly and may take several seconds even on fast machine. That’s why after export completes, these processes remain active

I understand the reason. Many thanks to explain and share knowledge! In other hands its also means: no GPU VRAM ‘auto’ memory purging in the DxO :frowning: (at least i not see it)

Personally i don’t think to save some ‘export startup time’ has the balance/advantage in this GPU VRAM hungry times. Other apps also use GPU, few example: Opera web browser use like 0.5GB GPU VRAM (for me), the very small ChatGPT client 0.2GB, and so on. Users may run out of VRAM fast, and i expect more and more app us more and more GPU VRAM in the future.

Of course if someone on like 16GB GPU VRAM seems this things not a biggie.
But if less GPU VRAM, like 4-6 GB, and Export process keep up like 1.3+GB (or multiple) for ‘just in case if you press the export button to save 4-6 second on the start of the Export’ - may the issues start to come - eg. the ‘Internal Error’ raised more times :frowning:

I got one of InternalErrors related to GPU just after starting PL9.1 and zooming the selected image (the one that was selected on previous PL shutdown), which was treated with AI mask. However, I couldn’t reproduce the error next time, so some timing is also important.

And that’s why i think GPU VRAM management is may need to improve in DxO side. Client GPU VRAM usage may vary too much. I pretty sure most of the ‘Internal errors’ related with GPU VRAM usage/amount.

Fixing will take at least several months, I think, as it seems NVIDIA is busy now with fixing MFG issues.

Personally i don’t think any nVidia update solve anything about the matter - eg. about the DxO Internal error thing. And ‘Internal error’ issues also raised in AMD GPU’s, so its seems more universal issue.

Ah, so that’s Microsoft terminology, seen also in Performance Counters. Probably this is part of CPU address space (in “standard” RAM) available to GPU managed by Windows (‘Shared GPU memory’, as seen e.g. in Task Manager, BAR1 memory in nvidia-smi terms; nvidia-smi shows only how much Windows kernel has reserved as a whole, 16GB in my case). No problem with that, it seems, the issue being with VRAM (GPU onboard memory, Frame Buffer (FB) memory in nvidia-smi language, shown as Dedicated GPU memory by Windows, 12GB in my case).

NVIDIA is known to have solved several similar problems, AMD code may have it’s own problems with memory leaks or not timely releasing memory. But maybe DxO’s or Microsoft’s code is also part of the problem. The thing looks complicated, as it seems there are some timing issues too. Just speculating, which I should stop :wink:

Luckily most of my AI mask tries didn’t crash and DeepPRIME previews work stably so far, albeit a bit slow sometimes. Perhaps DxO should tune it, but only after the basic stuff gets fixed. Never had a problem with exports, except that maybe they affect editing stability – maybe setting the number of export threads to 1 instead of default 2 would help (?). So far with PL9.1 got 4 InternalErrors, which required PL restart and had associated eventId 153 errors logged in Windows System EventLog by nvidia kernel driver nvlddmkm. With PL8.x I got no such InternalErrors and zero errors from nvlddmkm for a year, so I have plan B.

@andras.csore I had also wondered where your figures came from because I use, ‘Process explorer’, ‘GPU-Z’ and Task manager is also available. But when I started digging I aslo found the graph of the figures you showed which also includes the terms “Dedicated” and “Committed”!?

These are shown below from the 3060(12GB) with PL9.1.0 open on the directory with “Sky” preset AI images just after I “fixed” a camera flare spot.

Only ‘Process Explorer’ shows the “Committed GPU Memory”. I have been using “GPU-Z” because it monitors a number of factors on the one summary screen.

But this is referring to the export workers which are left “active” but doing nothing between exports. They can be safely terminated at any time, i.e. don’t play with the parameters, just terminate the export workers with malice aforethought!

@Wlodek Their initialization does not appear to be particularly “costly”, you just need to wait a little longer for the export process to start.

If the GPU is only being used for PhotoLab exports then you could leave them running or terminate them. I have “Process Lasso” running so a search for “PhotoLab” will locate the main “stack” and the export “stacks”, sorry reverting to my Burroughs/Unisys Large Systems terminology, and will allow me to terminate just the export workers easily.

Just out of interest this was after the export run of 6 “AI” images and the statistics for the first run and then a second run show as

So in this case the second run with the export worker already running actually took longer!?

@andras.csore I have seen both. I believe on the “skinnier” GPUs VRAM is the deciding factor but I cannot run the 3060(12GB) on the latest drivers at all.

PS:- If your machine can handle “Sleep” and being re-awakened successfully then “Sleep” appears to clear PhotoLab’s VRAM elements.

Well after your sterling work on investigating the various drivers with the 3060 GPU, I had gone back from the latest installed 581.15 to the previous 576.40 driver with my 3060Ti. Although my trial had finished I decided to take a chance and purchase PL9. I have since tested several images now and had only 1 failure of a keyword mask. So it looks like that the problem is for the most part been resolved. Certainly enough until hopefully DXO really sorts things out. Once again thanks for your help.

@KenA Fingers crossed that it is the right decision in the short term, I am sure that it will be in the long term.

If you want me to test your failing image on my 3060(12GB) then include it here or DM me and include the image or a pointer to it (or them if you want more than one image tested) and I will make a test.

If you don’t want the image “published” on the forum then if I find anything worth sharing with others then I will make sure the image is obscured, i.e. with the various statistics I collect but I can share the full details with you directly via DM.

Your 3060Ti(8GB) is faster than my 3060(12GB) but a bit smaller and with the current problems larger VRAM, and the right set of drivers, seems to help with some problems but not all!?

Well this evening I revprocessed last nights test images and PL9 behaved OK. The image I had problems with had no problems with any masks. So, not sure I did last night. I have found that saving a 57 MB canon CR3 RAW file with AI masking and Deep Prime XD/XD2S is taking around a minute to produce 1.3 MB JPEG image and uses between 75% to 81% memory.

@KenA VRAM or RAM?

I am glad it worked of the rerun but with PL9.1 in its current state it is difficult to assign the blame to anyone or anything!?

I made the above quote in a post above and I am about to start a new topic about how export worker structure seems to have changed, i.e. I believe that there is now only one export worker program (probably with multiple threads) and my attempts to terminate it once an export has finished have proven unsuccessful!?

Because of issues I had with the image supplied by @Allan in the topic For BHAYT Bryan - #3 by BHAYT I have reverted to the recommended 572.83 driver.

Not sure on if VRAM or RAM. I just viewed task manager where it just lists memory and cpu

GTX 1660 Super (6GB) with Studio Drivers 577.00, works for me with PL9.1, including all types of AI masks. However the peformance of my PC, when using PL9.1, is slow as expected. In particular export times (100% jpeg from 45MP Nikon camera) are extremely slow, around 4 minutes per image using DeepPRIME XD2s.

@mrcrustacean My images are typically not 45MB they are 20MB but can still cause problems with PL9, including PL9.1.

However running the 572.83 drivers I exported a downloaded Z8 image with a basic “Subject” AI to select the body of the pigeon including the tail and chose a couple of LA settings so that PL91 had some work to do! I made 19 VCs and exported 20 images with my 3060(12GB) and it took 12227MB of VRAM and took this long

I would be interested to see if that image will work on your GTX 1660 Super(6GB). Please feel free to reduce the number of VCs, I am really interested in whether it works at all not waste a lot of your time.!?

nikon-z8-raw-00008.nef (48.4 MB)
nikon-z8-raw-00018.nef.dop (208.2 KB)

The images were located on an old, slow NVME but on another computer so it was accessed via the LAN, but there is only one image to read and 20 images to write, also to the same location.

I then switched to the 5900X with 5060Ti(16GB) and got the following

The first image seemed to take 28 seconds to be exported on the first export and 20 seconds thereafter.

I then did a “Sleep” to clear VRAM and went straight into an export which reduced the memory being used dramatically. I reckon it took around 20 to 21 seconds to flag the first image as being exported and the VRAM usage is about half of the previous two runs (14292MB versus 7344MB).

In all tests the number of export copies selected in the ‘Preferences’ was 2.

Execuse me, could you tell, where this parameter is located?

@BHAYT Thank for the response Bryan, I will run some tests with the supplied NEF, later today. Regards Patrick

1 Like

@adi99 “But if @Wlodek told you he would have to “kill” you” to use the old spy thriller clichĂ©.

Plus it doesn’t seem to be quite what I expected, so I set the parameter to 60 and the current export worker terminated but was immediately replaced by a new copy, actually the new one was started before the old one terminated.

But in the process terminating the first copy released a large chunk of VRAM.

As @Wlodek indicated tampering with a products parameters is potentially “dangerous” to the stability of the product and the developers may well move the parameter somewhere else, or "bake it into the product itself, i.e. there is a risk that it will become a self-defeating exercise.

So I used my “Sleep” trick to clear VRAM and repeated the tests and PL9 failed!

So I just repeated it again and this time it worked and so did the “faster” auto-terminate and VRAM went down from 7671MB to 1441MB but if you don’t need to save that VRAM, i.e. you are going to do an another export does it help.

If the only way that you can make edits and do exports is to get them to use VRAM alternately then

  1. Make an edit
  2. Set everything up for the export
  3. “Sleep” the machine
  4. Wake the machine
  5. Immediately export without making any edit changes whatsoever
  6. Export and if you have adjusted the timer then your precious VRAM will be returned and you can conduct some more edits
  7. Repeat and/or wait for DxO to make all elements of the process less memory hungry and/or put the access to the parameter in the public domain.

@adi99 I can’t tell you either but look in the most obvious place and use a good editor to locate the value given already. Plus make a copy of the original config file before you do anything else.

Thanks. I’ll wait for DXO to resolve the matter. In addition I noticed, if I exclude use of predefined AI masks from my workflow (use of other general AI masks is not problematic) I don’t have export issues any more.

@BHAYT I downloaded the supplied Nikon Z8 NEF. The file opened without issue, and I applied an AI subject and background mask. I then applied a small number of local adjustments to the AI masks, plus some global adjustments.

I then created a set of 19 VCs, and attempted to export them as 100% jpeg using DeepPRIME DX2s, but failed miserably!

After restarting my PC, I exported a single image successfully.

I subsequently managed to export various numbers of 100% jpeg using DeepPRIME XD2s. As can be seen my computer took 54 min 19s to export 11 files.

Out of interest I will attempt to export the NEF & 19 VC, later and see if the export completes this time.