Highlight recovery

Thanks Greg for your comment. I now did follow the suggested order in the thread you have linked to. Indeed, if I first adjust the overall exposure to the highlights and afterwards pull up the shadows again, PL seems to be able to recover about the same range of highlights as LR.

Thank you very much :+1:

2 Likes

Do you have a reference for this? I would have thought that depended somewhat on the sensor and camera software? Not saying I disbelieve you, it’s just my mental model doesn’t understand why.

Hi, Joanna,

This is an interesting observation and I am trying to make sense of it. In a very simplistic sense, sensors are basically photon counters and count up until they can’t count any higher. ISO affects this only in the sense that, since the photon count is multiplied, the dynamic range is reduced–the maximum possible photon count is reduced by half for each ISO step up.

Given this, the goal might be to ensure that the brightest spot in a scene does not exceed the maximum photon count supported by the sensor at a given ISO. It’s interesting to hear that this exposure could be calculated as between 1⅔ and 2 stops above the exposure selected by spot-metering the brightest spot.

I tried to derive this number. Let’s say I have a white, evenly lit surface, meter it and take a photo based on the reading. I then read the pixel value of the unadjusted image–what is the pixel’s luminance value? I see some web says saying that meters assume they meter an 18% gray surface and then provide an exposure so that the result is 18% gray. So, in an 8-bit image generated from the unadjusted RAW file of my white surface, I would expect to see an RGB value of around (46, 46, 46).

Raising this by 2 stops gives me about (184, 184, 184). It looks like one could go another 1/3 stop above this.

If a meter reproduces 18% gray as 18% gray and if my camera uses a 12-bit sensor, then 10 stops below 18% gray will yield 0, which is the end of the line. This would not be true for a 14-bit sensor, of course, as it could go 12 stops down. As another corollary, every ISO step reduces the dynamic range in half, which is the equivalent to dropping a bit. So, if base sensitivity is ISO 100 with a 12-bit sensor, then ISO 200 would support only 9 stops of underexposure, ISO 400 would support 8 and so on.

I never really spent much time thinking about what the meter is actually doing. Of course, if one has an EVF, one could just look at the histogram to avoid losing of highlights.

Let me know if I misunderstood or made incorrect assumptions.

Part of the reason I asked is because of ISO-invariance. Which my sensor has.

https://photographylife.com/iso-invariance-explained

It’s interesting to think how one might take photos with a true ISO-invariant camera. Here’s how I might approach it:

  • Set the camera to base ISO.
  • Determine the slowest acceptable shutter speed.
  • Determine the widest acceptable aperture.
  • If the highlights aren’t blown (based on a histogram), take the shot.
  • Otherwise, use a faster shutter for narrower aperture until the highlights aren’t blown, then take the shot.

If you don’t want to use the histogram method, you could try the spot meter method. The goal is to make sure the highlights aren’t blown.

Camera manufacturers are producing ISO invariant-cameras, but don’t quite seem to know what to do with them. They don’t advertise this as a selling point, for example.

In my ideal ISO-invariant camera, the ISO setting would merely be a piece of metadata. It would be used to control the image shown in an EVF or the preview JPG (or final JPG, if not shooting in RAW mode). Post software could also use it to set the EV +0 level. But all shots would be taken without any ISO gain.

Instead, ISO invariant cameras still include the ISO gain circuits (or perhaps they perform the gain in software before writing to the RAW file). And if you try to shoot everything at base ISO, many shots will look underexposed or even totally black. With an EVF, you might not be able to see what you’re shooting. And your preview images might be a long sequence of black shots. It’s a sad waste of a powerful tool—with an ISO-invariant camera, you should never have to sacrifice the total dynamic range of the sensor.

Regarding your original question, I have been able to recover detail in the highlights of one shot in PL that other tools were totally unable to recover. I don’t have the latest version of Lightroom, though (I do have Adobe Camera RAW CS6). I’m not sure why you had problems with your shot. I’d have to know what you did or have a chance to work with your original RAW file. You might try using control points on the sun to see if that helps.

Hmm, be aware that the histogram (and blinkies) displayed by most cameras do NOT take their data from raw, but from the jpeg preview, which depends on the picture style, the WB and the colour space that you set in your camera. Over-exposure can happen in one or more of the r, g or b channels resulting in colours that can out of gamut or simply blown (usually in highlights)

The close to best way to make sure that your sensor’s photosites are not flooded is to use UniWB, a custom white balance setting that will provide outlandishly green jpgs and a histogram that translates raw data with preferably equal multipliers - check the wb multipliers (not quite perfect here) below.
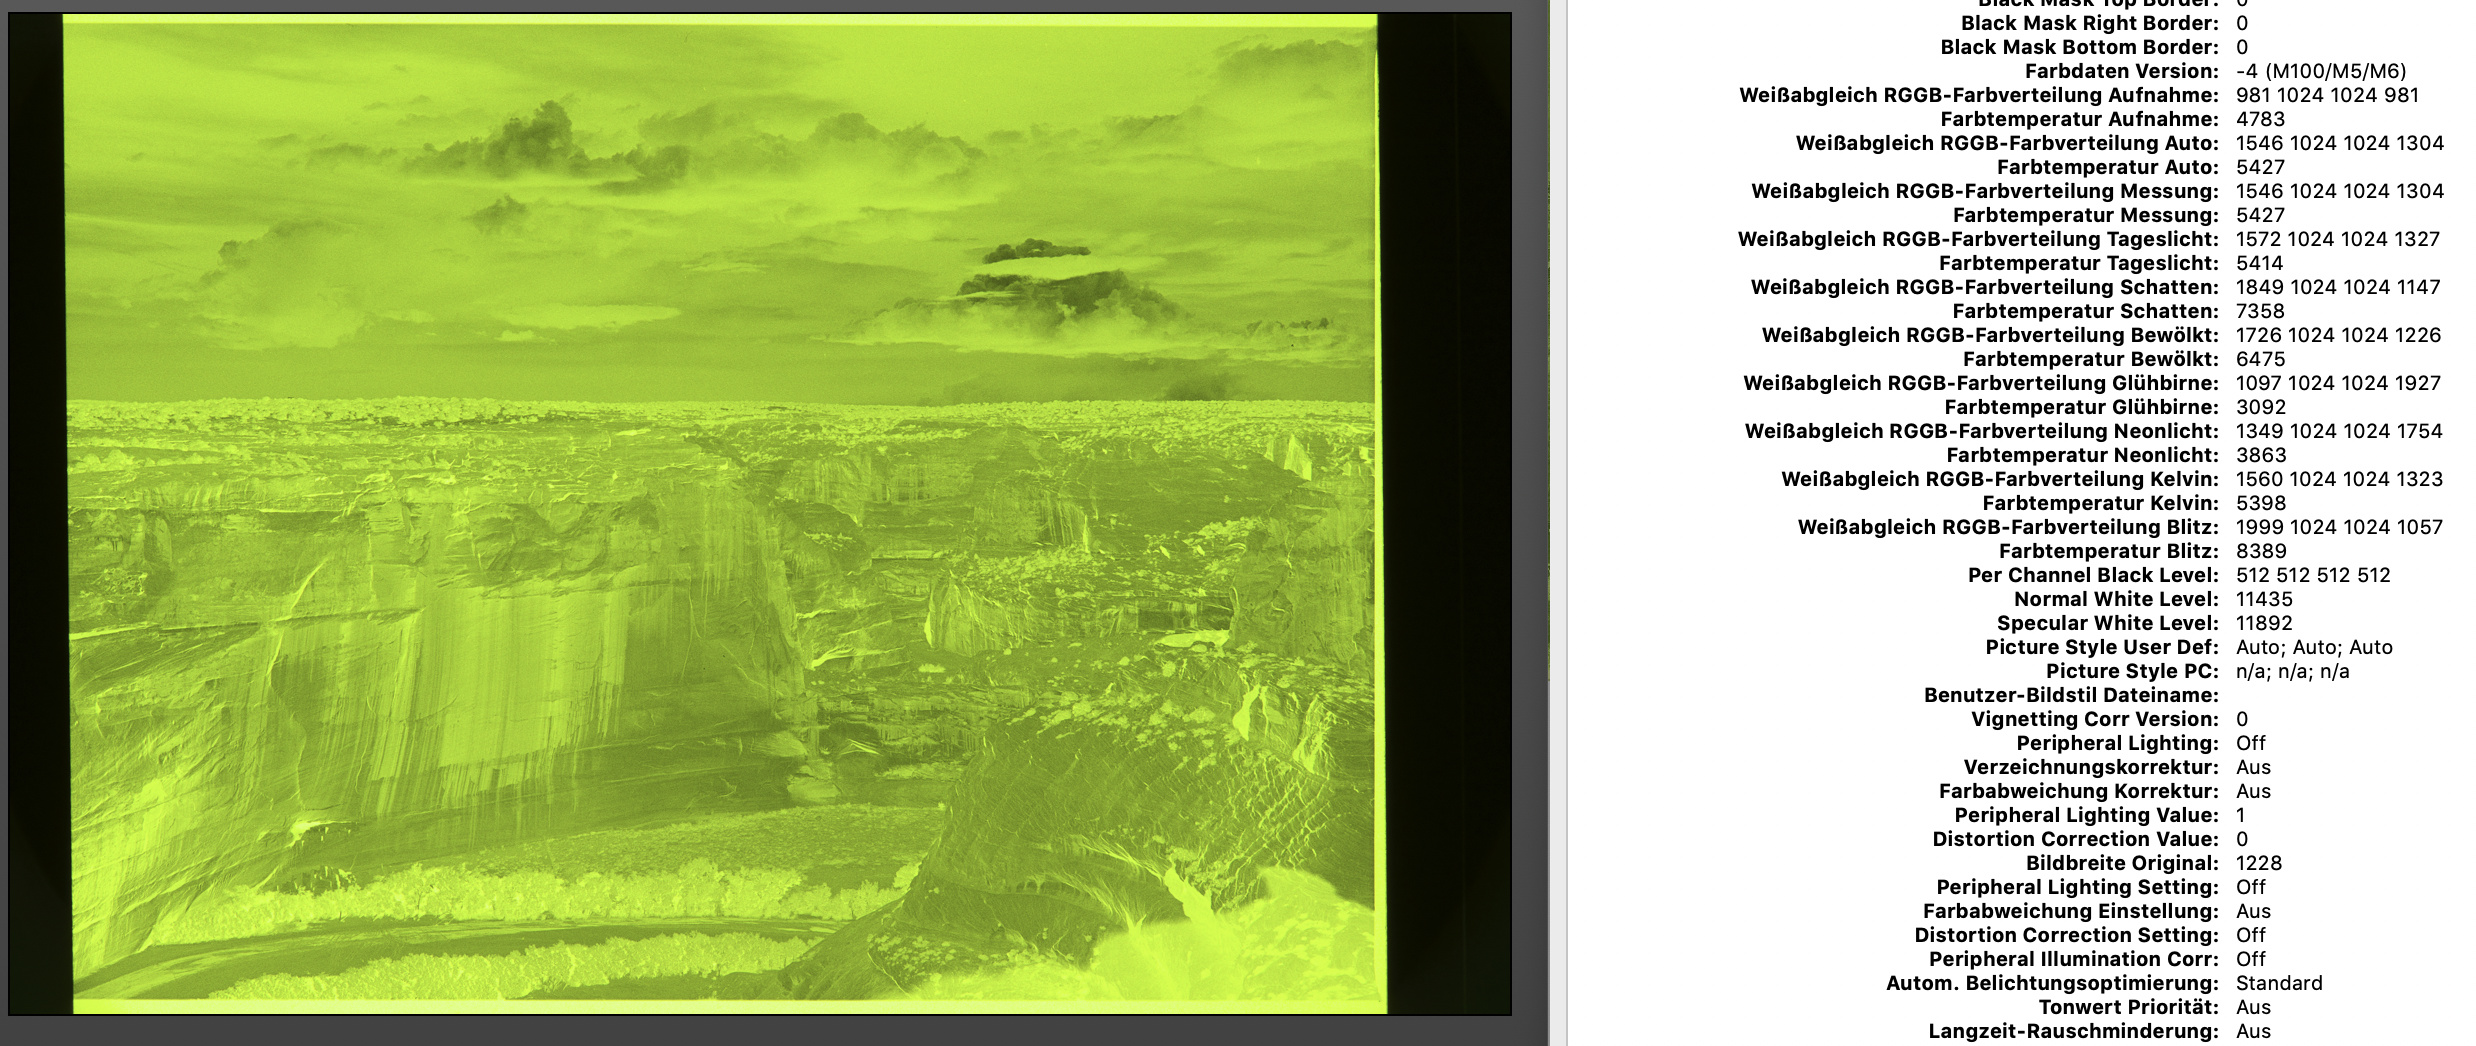
Ways to get UniWB can be found here http://www.guillermoluijk.com/tutorial/uniwb/index_en.htm or wherever you find it yourself.

My technique for determining how much over-exposure is too much is based on my experience with the Zone System, as used with B&W negative film, but adapted to digital sensors.

You can go to DxOMark to find out the dynamic range of most cameras. Then you need to run tests to find where 18% gray is within that range.

To find the highest end of the range, you need to use manual mode and meter off something white with texture (I used white kitchen roll with dimples in it). Start by taking an average reading from the towel - this will give you the 18% reading and the image will look gray instead of white because of this. Then increase the exposure in ⅓ stop steps until you can no longer see detail in the image. Assessment should be done by bringing the RAW files into DxO and adjusting the image until it is as bright as can be without blowing the highlights.

One of the images (usually somewhere between 1⅓ and 2 stops) will be where you start to lose detail. Now you know how much you can over-expose a spot reading from the brightest part of a scene without losing detail.

You can do the same, but with a black textured towel, until you find where the lowest exposure falls before losing detail. Or you can work it out from the DxOMark measurements.

Of course, as @geno shows, the sun and other specular highlights can never be truly recovered; they are way beyond the range of any medium, film or digital, and you should never attempt to meter off the sun or specular highlights anyway.

What @geno is trying to do in recovering highlight detail in the sun is simply impossible and, even with a RAW file, processing in any software can only really dull it down to a gray of around 250ish instead of 255.

2 Likes

@Joanna - no, I did not try to do impossible things. I just tried to get the same dynamic range out of my Image with PL as in LR. This was my question and the topic of this thread, nothing else.

1 Like

I’m sorry; I must have misinterpreted what you were saying.

Given the sample images you posted, exactly what was the difference you were seeing and which highlights were you trying to recover?

In my opinion, tthe main difference between the two images is, that the image from Lightroom has a warmer white balance. Therefore the sun appears more yellow, but the snow is not white and the mountains appear too blue-green.

I would try to put a U-Point on the sun and change the white balance for the U-Point so that the sun doesn’t appear so white/cold.

Regarding dynamic range I do not see any differance.

@Gerd: Notice the clouds / haze on the lower left of the sun. This area is completely burnt in the PL version. The WB had absolutely no effect on this. Believe me, I have spent whole evenings in this Image :crazy_face:

I will post crops later on, as well as crops from the current version following the process suggested in the thread @Egregius has linked to.

@geno, can you post your original raw somewhere accessible? I’d be interested in looking at the image with RawDigger and see what I can do in both Lr and PL.

Other than that, differences will always exist between different raw developers. Each app will deliver its own interpretation of the data provided, influenced by its camera profiles, colour management etc.

1 Like

Try using ClearView Plus

… with a U-Point/Control-Point - - via Local Adjustments.

John M

1 Like

I did use Clear View Plus in any setting you can think of.
@John-M, U-Points produce strong artefacts in that area. There just isn’t enough tonal resolution in that area because it is just too bright.

So theese crops show roughly what I could achieve (highlight recovery and getting a warmer colour of the sun). Now I have to get rid of the artifacts around the ridge.
Thanks to all for your comments :+1:

Thanks, Joanna, for describing your process.

For anyone interested, I found a detailed article on the topic at https://photographylife.com/how-to-use-the-full-dynamic-range-of-your-camera.

One of the errors I made was that 18% gray is not RGB (46,46,46). Intensity is not linear, duh!

RAW files may use different (and probably lower) definitions of middle gray. The article provides an elaborate way to verify how to properly meter your camera using a spot meter off highlights. The bad news is that the answer may vary depending on ISO. The author provides all the details needed to perform the calculations, but you need a ColorChecker, which I think currently runs over $USD100.

The result may not be in the 1 1/3 - 2 range. In the article, the camera the author used required a 3 1/3 stop drop off the highlights

This reminded me that luminosity steps are based on the log of the photon counts (one stop brighter doubles the photon count at the sensor). So, even if there are 10 steps below middle gray and 2 stops above, those two stops above may have as much detail as the 10 stops below.

1 Like

I read that article some time ago, found it overly complicated and somewhat confusing.

Which is when i fell back on the technique of how I would have worked out the limits of B&W negative film, but “reversed” for a positive image.

The simplicity of the “kitchen paper system” is that any exposure meter will always try to make what it is measuring into 18% gray. You don’t need all that stuff with Gretag Macbeth colour charts, etc.

As I mentioned before, the first exposure that you make should be an average reading with nothing but the kitchen paper in the shot. This will give you the EV for the shot at 18% gray. Take this shot and open it in DxO. If you want, you can increase the exposure in DxO until the over-exposure indicator comes on but, more importantly, you start to lose the detail of the texture in the paper towel.

Having done this for several cameras, I would be very surprised if you arrive at more than 2 stops of over-exposure.

You could also double check this by taking shots at increasing exposures (in ⅓ stop steps), examining them in DxO without increasing the exposure and seeing which shot starts to lose detail.

Whichever of these two approaches you take, it is much easier to do and doesn’t involve a colour chart and a load of maths.

I can only assure you that I have tried several methodologies, not finding anything easier and more reliable and the results of which I use almost every day in my photography with consistent results.

2 Likes

Yep, it’s pretty grim… :slight_smile:

The article mentions that for RAW the camera manufacturers may use 13%, not 18%. For your process, I don’t think it matters as long as you are consistent with the metering system you use (camera or external spot meter).

I’ll admit to not having done this for any camera. Purely as a spectator, the methodology used by the article writer to derive 3 1/3 stops seems correct. He doesn’t provide the name of the camera (as far as I could tell), so it’s hard to cross-check him.

My interest in all this tends to be academic. Lately, I’ve been shooting mostly birds. What that means is that there is often no time to do any fancy metering or calculations (or even composition).

If I get some extra time, I’ll give your procedure a try. It would be interesting to try it at ISO 100 and 6400 to see if there are any differences. Thanks for introducing the topic.

@geno

Apologies for hijacking your thread. You’ve already taken your picture and so any talk of adjusting your method of shooting is off-topic. On the other hand, it sounds as though you’ve resolved your problem, so that’s good. Even in the initial images, the PL version had better sky and snow details and less water glare.

The 18% comes from the printing/painting world. Mixing equal parts of pure white and pure black gives a middle gray that reflects 18%of the light. The light meter is calibrated on that value so that specific middle gray will have a digital value of 128. Some meters are calibrated on 12% or 20%.
I think the lee you’ve in RAW for exposure is due to the gamma correction. The jpg values are gamma corrected. You can see that lee in the raw converter. Exposure correction is based on the raw values. Watch the histogram when moving the exposure slider. It’s not linear.

George