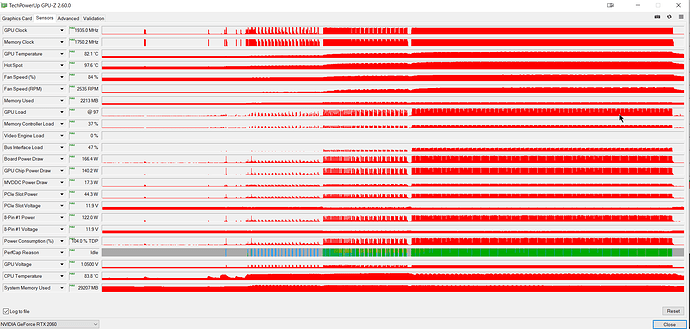
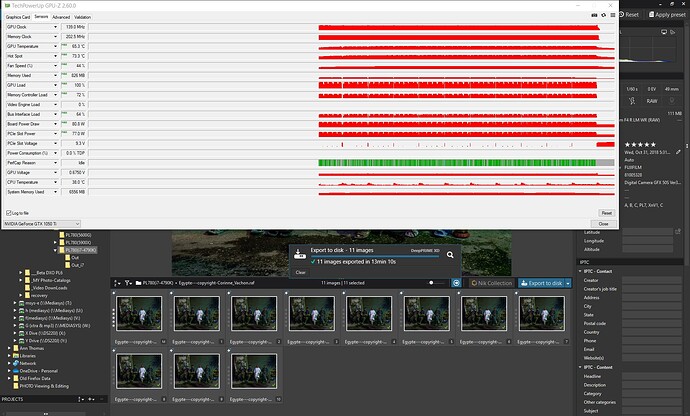
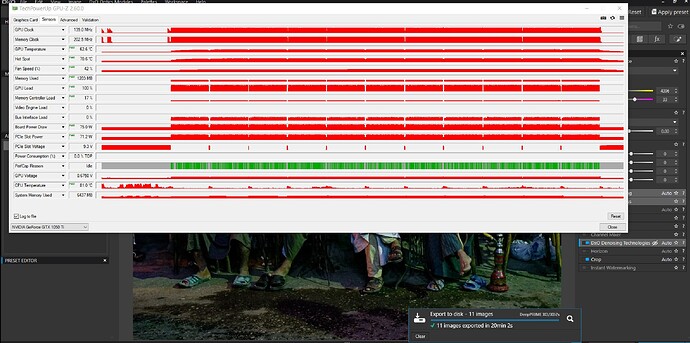
@Wlodek Although it might be a “red herring”, when I tested DP XD2s on the GTX 1050Ti card it was 50% slower than DP XD.
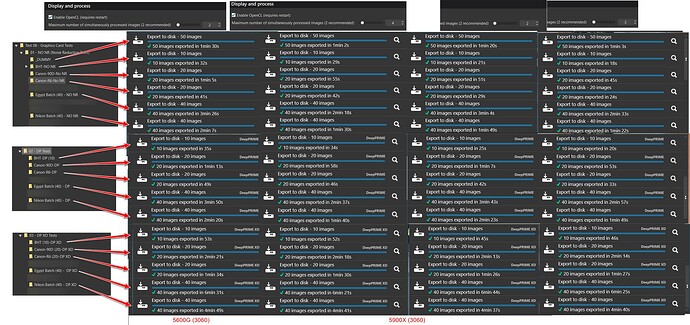
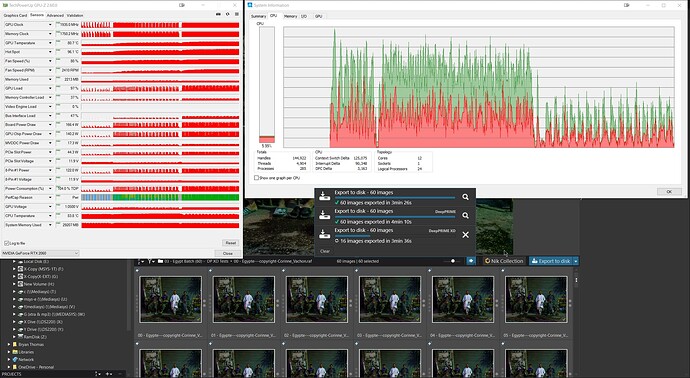
I theorised in one post or another that it might be a fact for all GTX cards because my RTX 2060 and RTX3060 showed what I had seen during testing, that typically DP XD2s was typically (very) slightly slower than DP XD on my systems (during the testing stage of the product I was testing first with the 5600G and then later with the 5900X but using the RTX 3060 throughout).
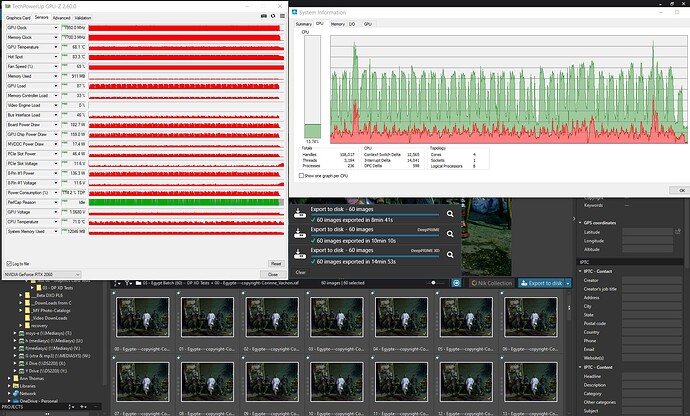
I only started testing PL8 with the RTX 2060 after the product was released. Plus the following are the tests with the GTX 1050Ti which I also only tested after PL8 was released.
The reason for asking for NO NR test figures is because this represents the rendering of the edits minus Noise Reduction (as the naming implies).
So I take the NO NR figure from the DP and DP XD(2s) figures to give “more accurate” timings to the portion of the export that is largely determined by the GPU (with some CPU involvement, which isn’t easily measured!)
So with the @MalcolmC figures we have CPU = 25 (for NO NR), (155 - 25) = 120 (DP) and (399 - 25) = 374 (DP XD2s) for the GTX 1650Ti
and then CPU = 22 (NO NR!), (27 - 22) = 5 (DP) and (60 - 22) = 38 (DP XD2s) for the RTX 4060
That yields an improvement of (129/5) = 25.8 (DP) and (374/38) = 9.84(DP XD2s) which is really “scary” and completely “out of whack” with the benchmark sites assessment of the 1650Ti with the 4060!?
Comparing the overall timings would give 25/22 = 1.136 but its the same processor(!?), 155/27 = 5.74 (DP) and 399/60 = 6.65 (DP XD2s).
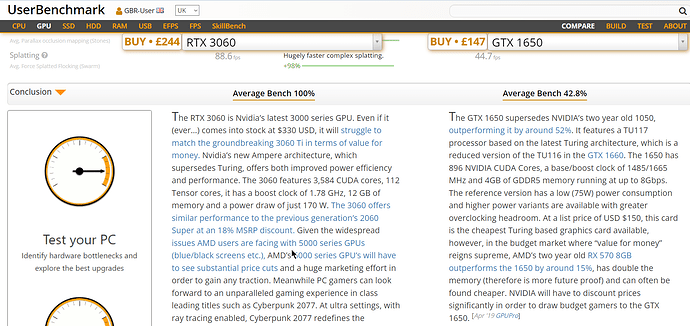
My favourite GPU site puts the 1650 versus the 3060, but doesn’t have a figure for the GTX 1650Ti as performing like this
and against the 4060 like this
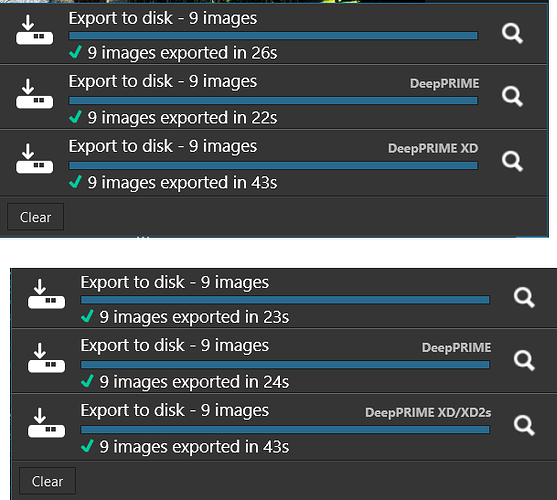
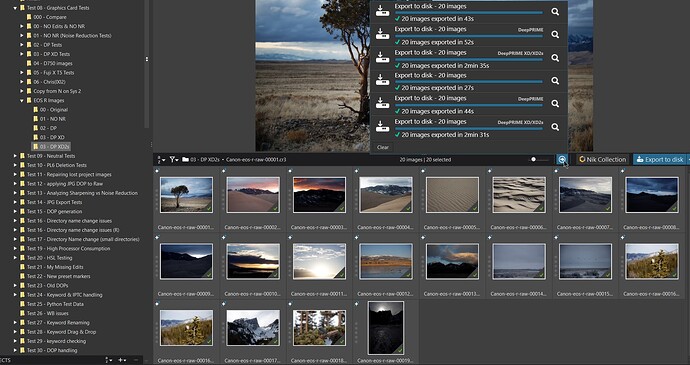
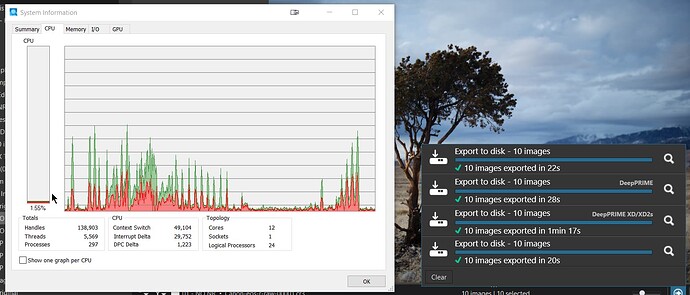
Instead of trying to compare the 20 image run I had done with a 10n image run I reran my tests with 10 images and then the NO NR test again because I start all my tests one after the other and that means the PL8 setup for the DP and DP XD2s tests will overlap with the actual running of the first NO NR and potentially steal processor away from the test (I sometimes use a DUMMY test for that purpose), so we have
My figures for 10 potentially similar images with the 5900X and an RTX2060 are 20 (NO NR), (28 - 20) = 8 (DP) and (77-20) = 57 DP XD2s)
versus for 10 images with a Intel 11700kand an RTX 4060 we have 22 (NO NR!), (27 - 22) = 5 (DP) and (60 - 22) = 38 (DP XD2s) for the RTX 4060
The slower CPU (the Intel) wasn’t much slower in the NO NR test 22/20 = 1.1 to the 5900X, the DP tests 8/5 = 1.6 to the 4600 and the DP XD2s tests 57/38 = 1.5 to the 4060 over the 2060.
If you compared the overall times you would have 22/20 = 1.1 time faster to the 5900X, 28/27 = 1.03 times faster to the 4600 and 77/60 =1.28 to the 4600.
Hence, my trying to be slightly more “accurate” using the NO NR figure but they tend to show GPUs performing much worse doing DxPL exports than GPU Gaming benchmarks seem to show when comparing one GPU with another.
