DxO Photolab 9 is unusably slow, like it is frozen

Not exaggerating, and I think I maybe doing something wrong.

On Windows 11, CPU is Ryzen 5600, 64 GB system RAM, GPU is Nvidia RTX 5090.

I keep my photos on a NAS which is connected via 2.5 Gbps connection, and on Photolab 8, it is very responsive when I access it. Say in a folder with maybe 1000 photos for example. I just tested and it is still the case, as a control for PL9.

With DxO Photolab 9, and opening the same folder, the software becomes so slow that it looks like it is frozen, and things on the GUI only change every few seconds.

As PL9 seems to have some updates on how it manages the photos, maybe it is doing some indexing? Can this be disabled? This basically disables the software for me.

I guess I am not the only one seeing this, so I think you may have a quick solution to it.

To show the differences, here are two video I just took for PL8 and PL9.
(The folder contains photos taken today, so it is new to both software)
PL8:

PL9:

A case has also been submitted to tech support.

2 Likes

Same Experience here

Bought me a GMX Laptop last december

I9 14th gen 24 core
NVIDIA RTX 4080
64 GB. RAM

It is super slow sometimes AI masks crash
And The Masking and the Naming of Masks in comparison to PL 8 are very contra intuitive…

Been using PL 5, 6 and 8
As Well as several Nik Collections currently NC 7.

But PL 9 till now is a major bummer can’t get it right…

Still have the test version… But if things do not improve I will stay with my work flow of Combining Lighroom Classic and PL 8🙄

If may i can suggest to try a few thing to narrow down the issue:

  • If you copy the same folder (not another folder, the same) to your local PC, browse the folder, what the performance?
  • May worth to check the PL cache folder / cache size (Edit → Preferences → Performance), may also worth to try clear the cache).
  • You do some “Auto apply preset”? If yes, may turn off (to check)
  • File transfer performance for PC ↔ NAS via File Explorer or whatever? Its good as it was, or as its expected ?(2.5G is very-fery fast). Try to do the copy to some totally different folders. And also check if you copy to the exact folder in the NAS.
  • Antivirus software? Some of them can raise issues (like continuous checking on cache folder, etc.). May try to disable for a few minute.
  • Try folder with fewer photos, like not 1000 but 50. Issue is the same?
  • With ‘older’ photos folder (from different camera body, whatever) behave in the same?
  • I guess your NAS may have some performance monitor / log files or similar, may worth to check it (like error log has 1000 error message when you open the folder via PL9). NAS may also raise their own problems sometimes.
  • Check the PL9 Log file. Its usually somewhere like: drive:\Users<your username>\Documents\DxO PhotoLab 9 logs\ . May DxO.PhotoLab.txt file say something.
  • Add-on: Behavior is the same, if you browse folder with 1000 Jpg (jpg only, no raw in the folder)?

One very advanced tool to check file operations (under Windows): Microsoft Process Monitor (Procmon). https://learn.microsoft.com/en-us/sysinternals/downloads/procmon
Its can track down file operations in very deep details. Note: its also can log lot of other things, not just file operations. I use it for ages, it’s helps me out in lot of cases when ‘magic happen’, and no one can find where is the issue.
I not say its easy. I not say its point out issues instantly. Its can provide something like this:

I have the same issue with PL9, PL8 works well. It happens even for a folder with a handful of images. It looks like a problem with loading big RAW files on a networked file system. Opening the same images copied to a SSD connected via USB 3.2 is very fast.

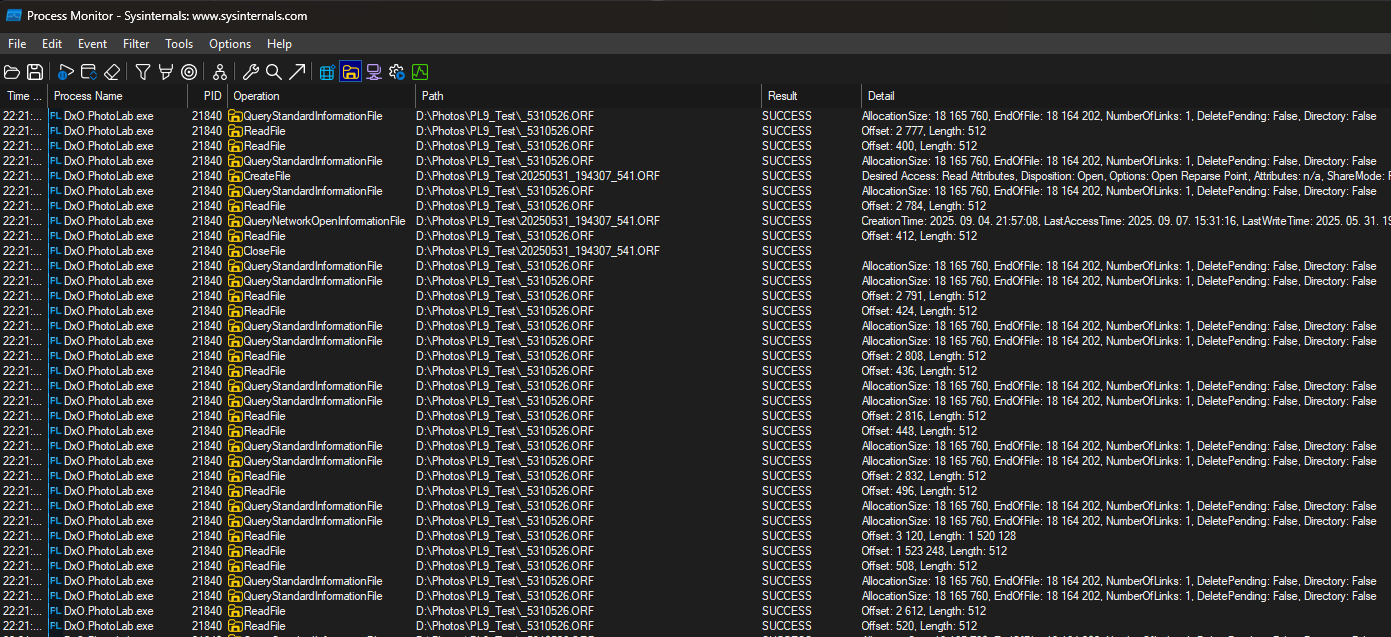
So, I investigated a bit by using procmon (after long long time i don’t use this tool) and it looks like it is not really directly a Photolab problem, some API calls just take forever, here an example of both fast and slow ones from procmon (the second from last is the duration):

"22:46:56,6068013","DxO.PhotoLab.exe","2532","QueryStandardInformationFile","\\192.168.1.135\share\scambio2\ph\20250915canottieri\DSC_7405.NEF","SUCCESS","AllocationSize: 16.482.304, EndOfFi
le: 16.481.280, NumberOfLinks: 1, DeletePending: False, Directory: False","0.0000018","19184"
"22:46:56,6068096","DxO.PhotoLab.exe","2532","ReadFile","\\192.168.1.135\share\scambio2\ph\20250915canottieri\DSC_7405.NEF","SUCCESS","Offset: 202, Length: 512","0.0000077","19184"
"22:46:56,6068270","DxO.PhotoLab.exe","2532","QueryStandardInformationFile","\\192.168.1.135\share\scambio2\ph\20250915canottieri\DSC_7405.NEF","SUCCESS","AllocationSize: 16.482.304, EndOfFi
le: 16.481.280, NumberOfLinks: 1, DeletePending: False, Directory: False","0.0000017","19184"
"22:46:56,6068344","DxO.PhotoLab.exe","2532","ReadFile","\\192.168.1.135\share\scambio2\ph\20250915canottieri\DSC_7405.NEF","SUCCESS","Offset: 214, Length: 512","0.0000073","19184"
"22:46:56,6068577","DxO.PhotoLab.exe","2532","QueryStandardInformationFile","\\192.168.1.135\share\scambio2\ph\20250915canottieri\DSC_7405.NEF","SUCCESS","AllocationSize: 16.482.304, EndOfFi
le: 16.481.280, NumberOfLinks: 1, DeletePending: False, Directory: False","0.0000031","19184"

"22:46:56,6086866","DxO.PhotoLab.exe","2532","ReadFile","\\192.168.1.135\share\scambio2\ph\20250915canottieri\DSC_7405.NEF","SUCCESS","Offset: 1.169.920, Length: 15.311.360","37.1390764","19
184"
"22:46:56,6094074","DxO.PhotoLab.exe","2532","ReadFile","\\192.168.1.135\share\scambio2\ph\20250915canottieri\DSC_7405.NEF","SUCCESS","Offset: 2.097.152, Length: 2.097.152, I/O Flags: Non-ca
ched, Paging I/O, Priority: Normal","10.1017517","19184"
"22:46:56,6095434","DxO.PhotoLab.exe","2532","ReadFile","\\192.168.1.135\share\scambio2\ph\20250915canottieri\DSC_7405.NEF","SUCCESS","Offset: 14.680.064, Length: 1.769.472, I/O Flags: Non-c
ached, Paging I/O, Priority: Normal","37.1357834","19184"

The real interesting part, is that, when I tried DXOPhotolab 8 yesterday night to get a “good trace” it showed the same slowness problem. This morning, both 9 and 8 are perfectly fine. BTW this was with 9.0.1, only now I got prompted to upgrade to 9.0.2.

I fed all the information that I have to Gemini Deep Research and I got this: Slow SMB File Access Diagnosis - Google Docs . Considering the intermittent nature of the problem and the suggestions by @andras.csore and Gemini, I suspect that it might be an interaction with some file protection mechanism. The trace doesn’t show Photolab building indexes (there are basically no syscalls for up to 10s) and Photolab’s CPU usage during the 30s + stalls is very low. Probably the upgrade to Photolab 9 triggered some rescanning and so the upgrade itself looked like the culprit. If I experience this problem again, I will try to disable real time protection and see if it goes away.

Thanks for the suggestions!

1 Like

Great findings! Great Job! @chripell
The Gemini summarize is great! Its describe all the possible and reasonable cases!
Yep, read takes up a lot of time, the fast vs slow case interpolate the read times, the “slow” 37s read can be in “fast” case approx 0.23 sec.
Yes, i also think the file protection seems the main suspect.
OpLock also can be a nasty thing, but its rare.

Sorry for necrobumping this thread, I finally found the cause of the slowness on my setup. What was happening is that for reason that I still don’t understand, local lan traffic was being routed via Tailscale. The really really strange thing is that this was happening rarely and then fixed itself. Killing Tailscale solved the problem. I realized this by watching the Performance tab in Task Manager and noticing that, when loading an image the traffic was on the Tailscale “Ethernet” as well, capped to 2 Mbps.

4 Likes

Never sorry! You find out, and feedback give more knowledge for all of us!

1 Like