Hello,
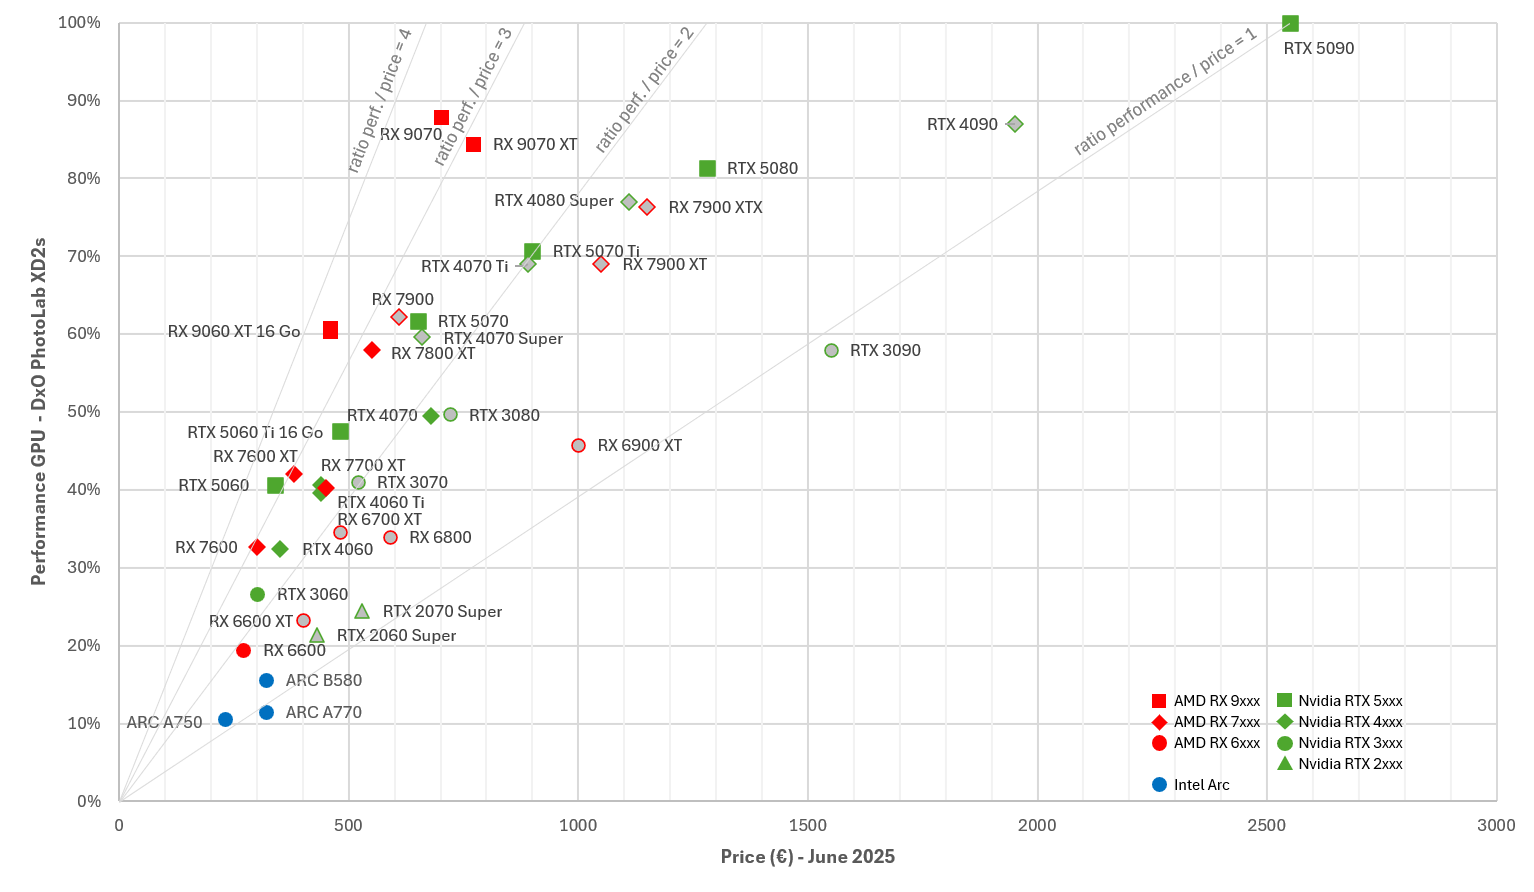
for its GPU comparison tests, the French website Hardwareand.co uses DxO PhotoLab in its latest version on a sample of 88 photos and measures development time with DeepPRIME XD2s. Thanks to these results, I was able to draw up this graph, which will be very useful when choosing the graphics card best suited to DxO.
The performance of the GPUs (desktop versions) is measured against the most powerful and most expensive, the Nvidia RTX 5090, which serves as a benchmark in terms of performance and price. For example, a GPU with 25% less performance will take 4 times longer to process the same photos.
The price indicated is that of a French online retailer, for graphics cards available at the beginning of June 2025. For older GPUs that are no longer available (grey dots), I have used the manufacturer’s launch price (MSPR). It is therefore possible to find them at other retailers, at different prices.
The “performance/price ratio” lines indicate which GPU is best placed for its price. For example, the line ‘performance/price ratio = 2’ indicates that a GPU is half as expensive for its performance as the Nvidia RTX 5090.
In this game, the AMD Radeon RX 9060 XT 16GB GPU comes out on top: with a ratio of 3.35, it requires only 65% more time for less than a fifth of the price of the Nvidia RTX 5090. By contrast, the cheapest GPU in this table, the Intel Arc A750, costs just under a tenth of the price of the Nvidia RTX 5090, but will require almost 10 times as much time. Not exactly a bargain. It is better to pay 300 euros with an AMD RX 7600 and already get 33% of the performance, or 340 euros and 41% with the Nvidia RTX 5060.
Finally, there seems to be every reason to prefer the latest-generation GPUs (AMD RX 9xxx / Nvidia RTX 5xxx), which are generally better placed than the models they replace.
Excellent analysis!
I often watch Hardware & Co’s reviews, and it’s true that in Photolab, Radeons have absolutely nothing to envy from RTXs.
Since I’m currently looking to build a new PC, there’s a very good chance it’ll be with an RX 9060 XT or 9070.
I’ve been wanting to build a full AMD PC for a long time, and that’s confirmed.
The only unknown is the Adrenalin drivers, which don’t always get good reviews compared to nVidia Studio…
User feedback on this would be very interesting.
And especially what settings are optimal in these drivers, given that I don’t play games at all…
Fantastic work! I’ve been contemplating a possible GPU upgrade specifically to improve DXO workflow performance and was eyeing the 9060 XT 16GB. Looks like its a winner!
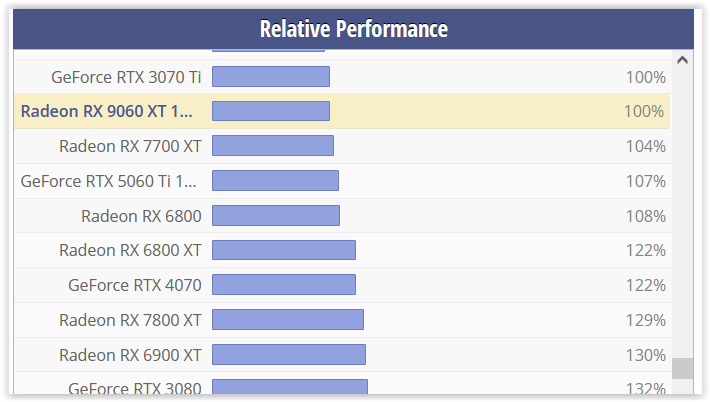
What interests us here is the performance in Photolab.
And the Radeons perform very well in this case !
On the other hand, for someone with other uses, such as video editing, the choice might need to be reconsidered, but that’s an area I’m not familiar with.
As I mentioned above, it would be interesting to have user feedback on the best settings for the Adrenalin drivers.
Excellent idea and well done. Kudos!
I was spoilt for choice couple of months ago to speed up PL denoising and wish I’d had the graphics back then. However I’m sure it’ll be of big help for others in that situation.
Because the data on Apple’s integrated GPUs doesn’t exist on the high-tech news site I used. On an Apple machine, you can’t change the GPU independently.
For Apple Mx and their integrated GPUs, you can look up their FP32 performance to compare with PC GPUs.
This might give you an indication of the DxO denoising performance you can expect.
Apple Silicon benchmarks would be incredibly useful.
DxO have done a very good job (imo) at optimising DeepPrime for the Apple Neural Processor.
On my (now old!) M1 Mac Mini, image export with DeepPrime is significantly faster when using the NPU compared to the GPU.
However, the Pro and Max SoC have the same number of NPU cores as the base chip. Only the Ultra has more NPU cores that all the other chips in of the same generation.
However, as you go up the chip hierarchy (ie M1, M1 Pro, M1 Max, M1 Ultra), and from older generations of SoC to the newer ones, the number of GPU cores does increase,. At some points along the chip timeline there must be a tipping point(s) where the GPU performance exceeds the NPU performance and vice versa?
In addition, it is unclear (to me at least) how the NPU performance improved from the M1 to the M2, to the M3. However, it does seem that the GPU performance improved with each processor generation.
I believe the latest M4 does have a significantly improved NPU though.
So essentially, with an Apple Silicon Mac, the GPU performance isn’t the only important performance figure to compare between models.
Simply download the images by following the links at the top of the spreadsheet.
Then process the photos and fill in the spreadsheet with your results.
You must use a Google account to have authorisation to write to this file. If not, you can ask.
I’m not the owner of the file (I don’t know who is), but when I asked, authorisation was given.
Hello,
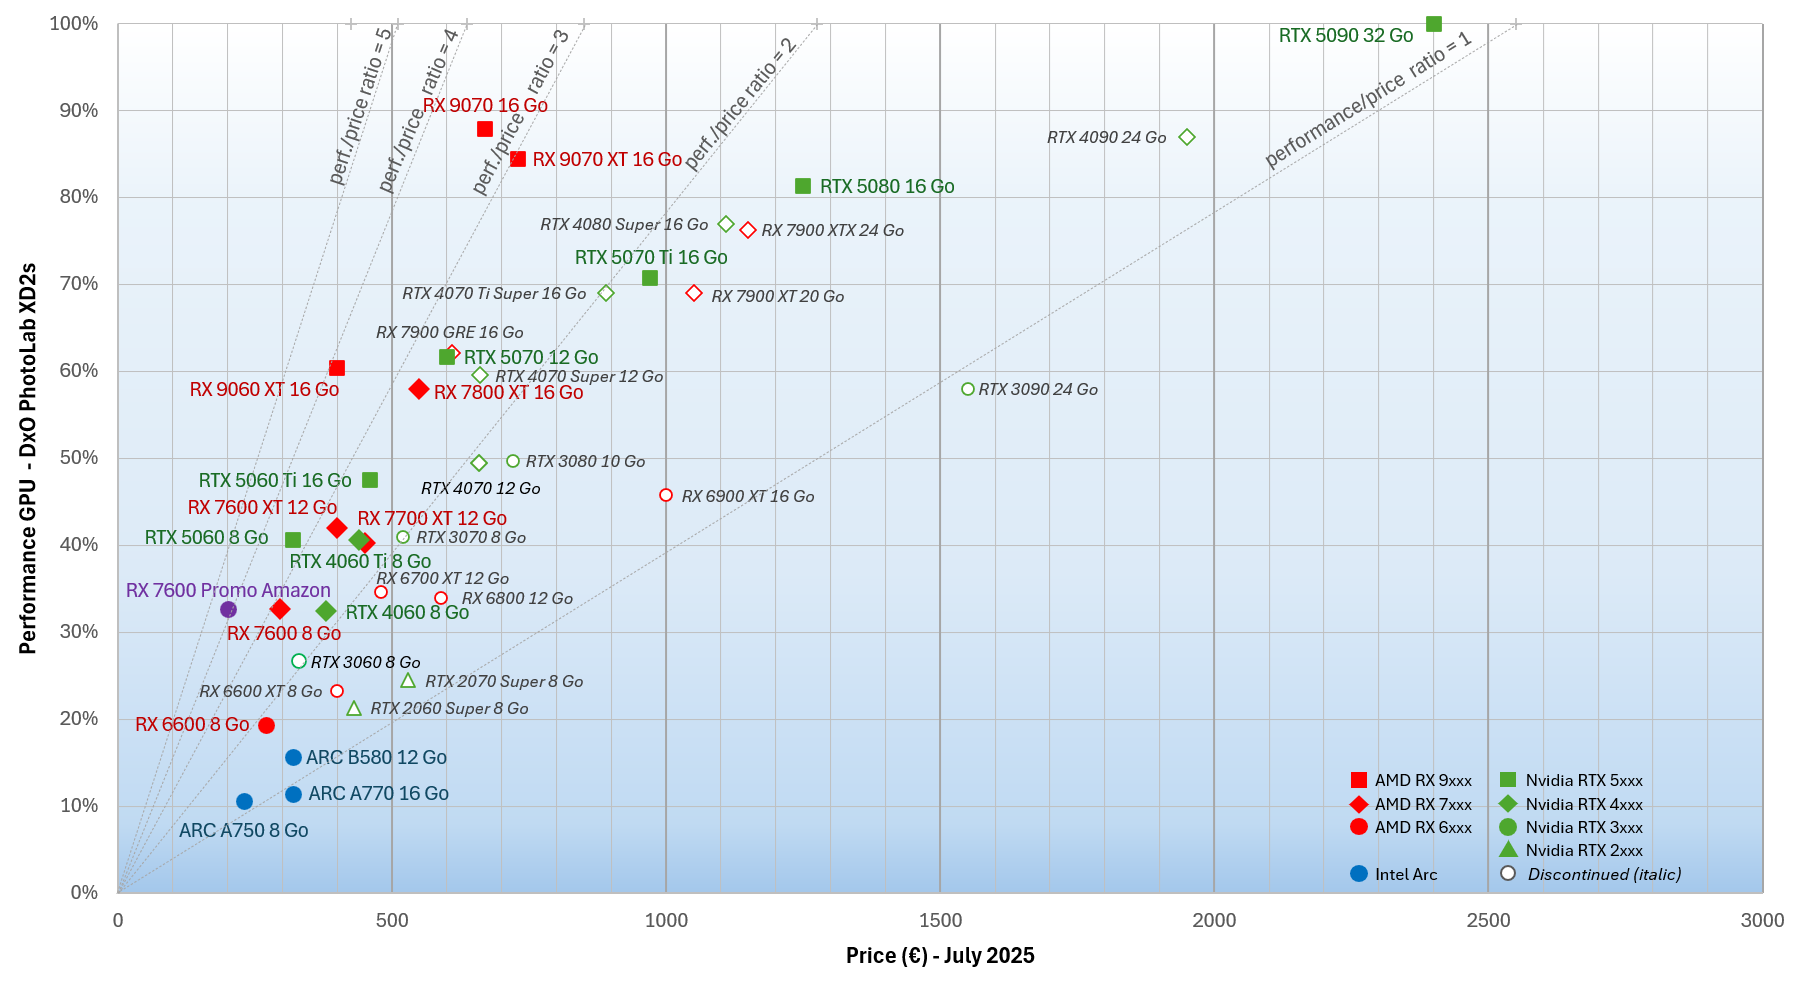
A quick summer update on GPUs for DxO. Please refer to my first post on this topic with data from June 2025 for explanations of this graph.
In July (compared to June), there was a general price drop of around €30 on most GPUs.
Of particular note is a very attractive promotion on the AMD RX 7600 GPU, with the price of the “Sapphire Pulse AMD Radeon RX 7600 Gaming 8GB GDDR6” card falling to €200 on Amazon:
For €200, you get 33% of the performance of an Nvidia RTX 5090, which sold for €2,550 in June, giving it a performance/price ratio of 4.17. It’s truly unbeatable as a low-cost replacement for an outdated graphics card.
Outside of promotions, the AMD 9060 XT 16 GB GPU retains its title as the champion of performance/price ratio with 3.85, offering 60% of the performance of an Nvidia RTX 5090 GPU for €400.
Finally, if you want an Nvidia GPU that is better optimized than AMD for Adobe software, check out the RTX 5060 8 GB, which for €320 still offers 40% of the performance of the RTX 5090 with DxO software.
Is there any information on the raw files in use? As surely the image size, bit depth and maybe how the raw file is composed would have an effect on the outcome if tests were done using files from different cameras. Then what is the graphics card connected to? CPU choice as well as system ram could also have an effect on the outcome.