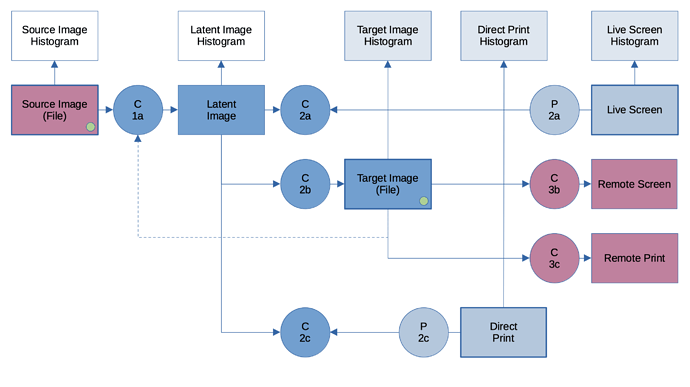
The main track leads from the Source Image to Live Screen output
- Items in blue are more or less under control of DPL
- Colour conversions take place in three places
C1a → colour conversion when the source file is copied to the latent image
C2a → colour conversion depending on WCS and Softproofing settings
P2a → display profile (calibration and native) DPL might know about it
The second track leads from the source image to the Target Image file
- green dot → CM info based on export options
The third track corresponds to directly printing with DPL.
Histograms
- I suppose that we can see histograms of target image, the direct print image and live screen image. Which histogram is displayed depends on how we set soft proofing
- I suppose that what’s shown in the histogram is derived from the latent image, modified by softproofing settings…which means that the arrows pointing to the histograms are showing what the histogram represents rather than the actual data flow.
- As of now DPL can not show the source histogram directly.
Items in purple are not under control of DPL.
Who said things were simple?