take a “greyscale” raw with patches covering all values, you will see something like in attached graph, using for example L* Lab values ( here illustrating L* range from 60 to 100) from exported TIFF ( orange = true linear curve, blue = what DxO PL does with linear curve )
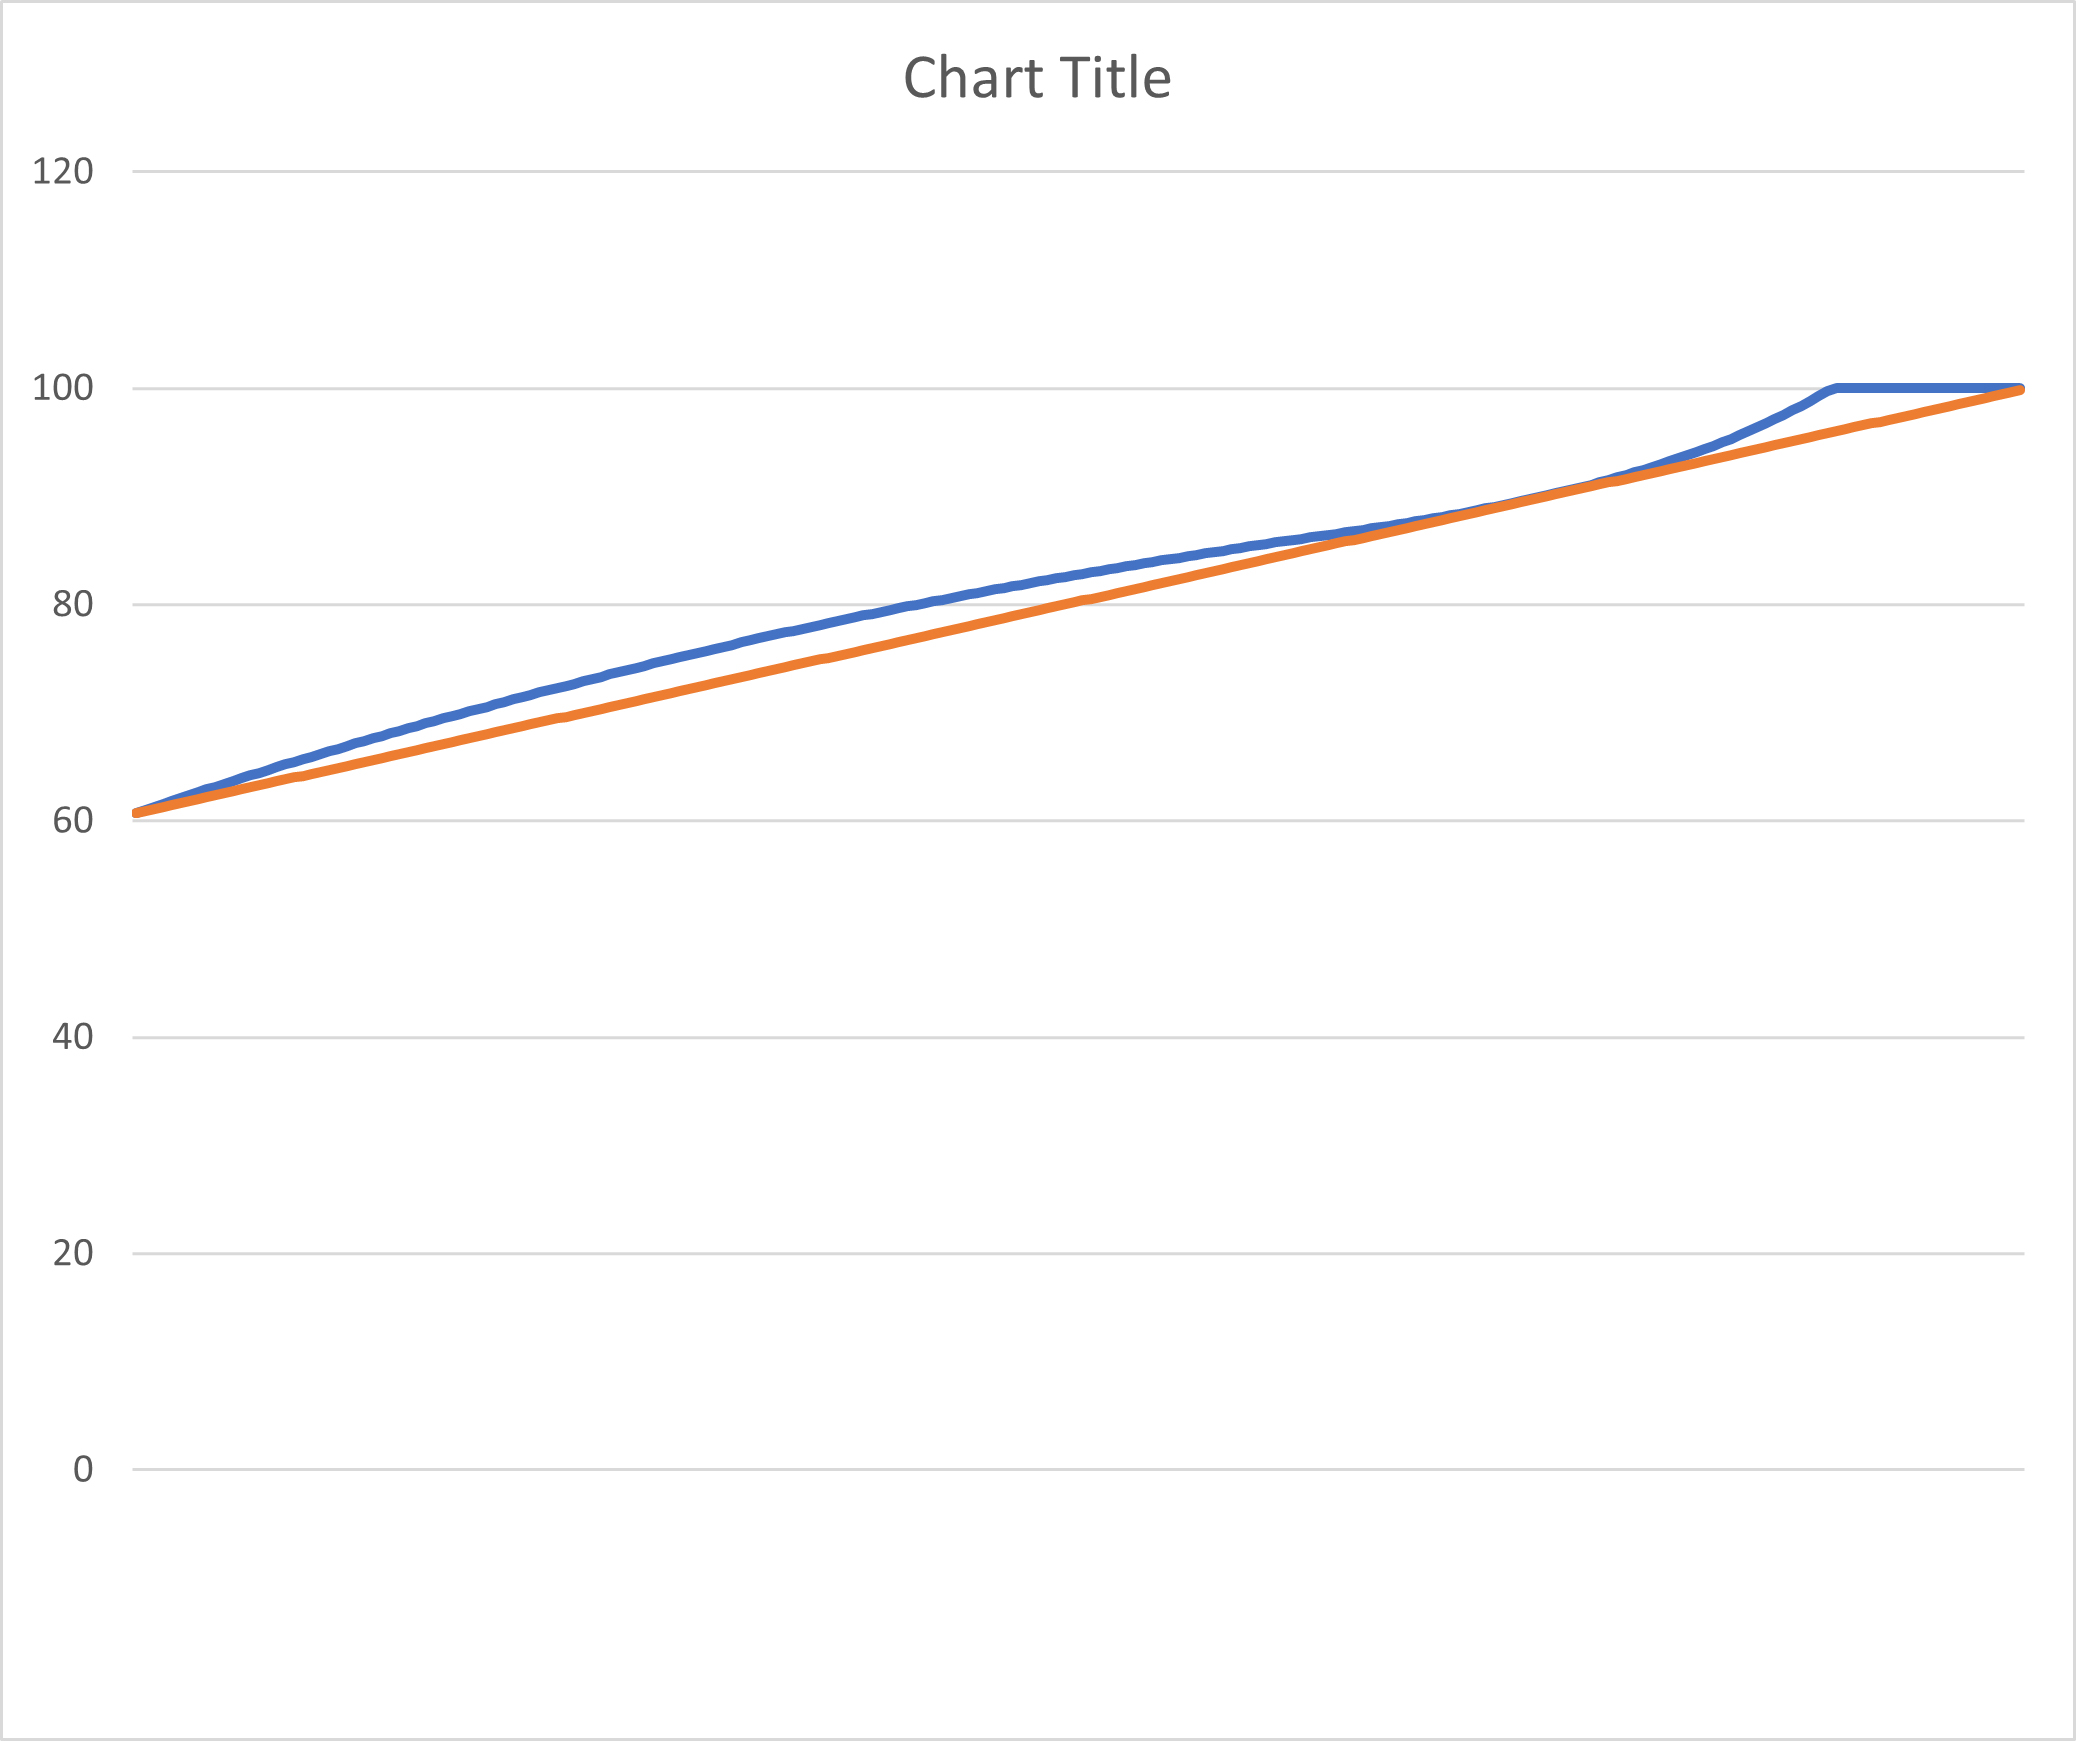
does it affect “colors” a lot ? no - but is it linear ? NOT AT ALL … a bit pregnant = PREGNANT
to illustrate more clearly → difference (from tiff output, same raw as for the graph above) between rendering of the same DNG raw with the same DCP profile ( matrix with explicit linear curve in it ) between DxO PL6 and ACR 15.5 ( Y-Y from xyY = blue color and L*-L* from Lab = orange color )
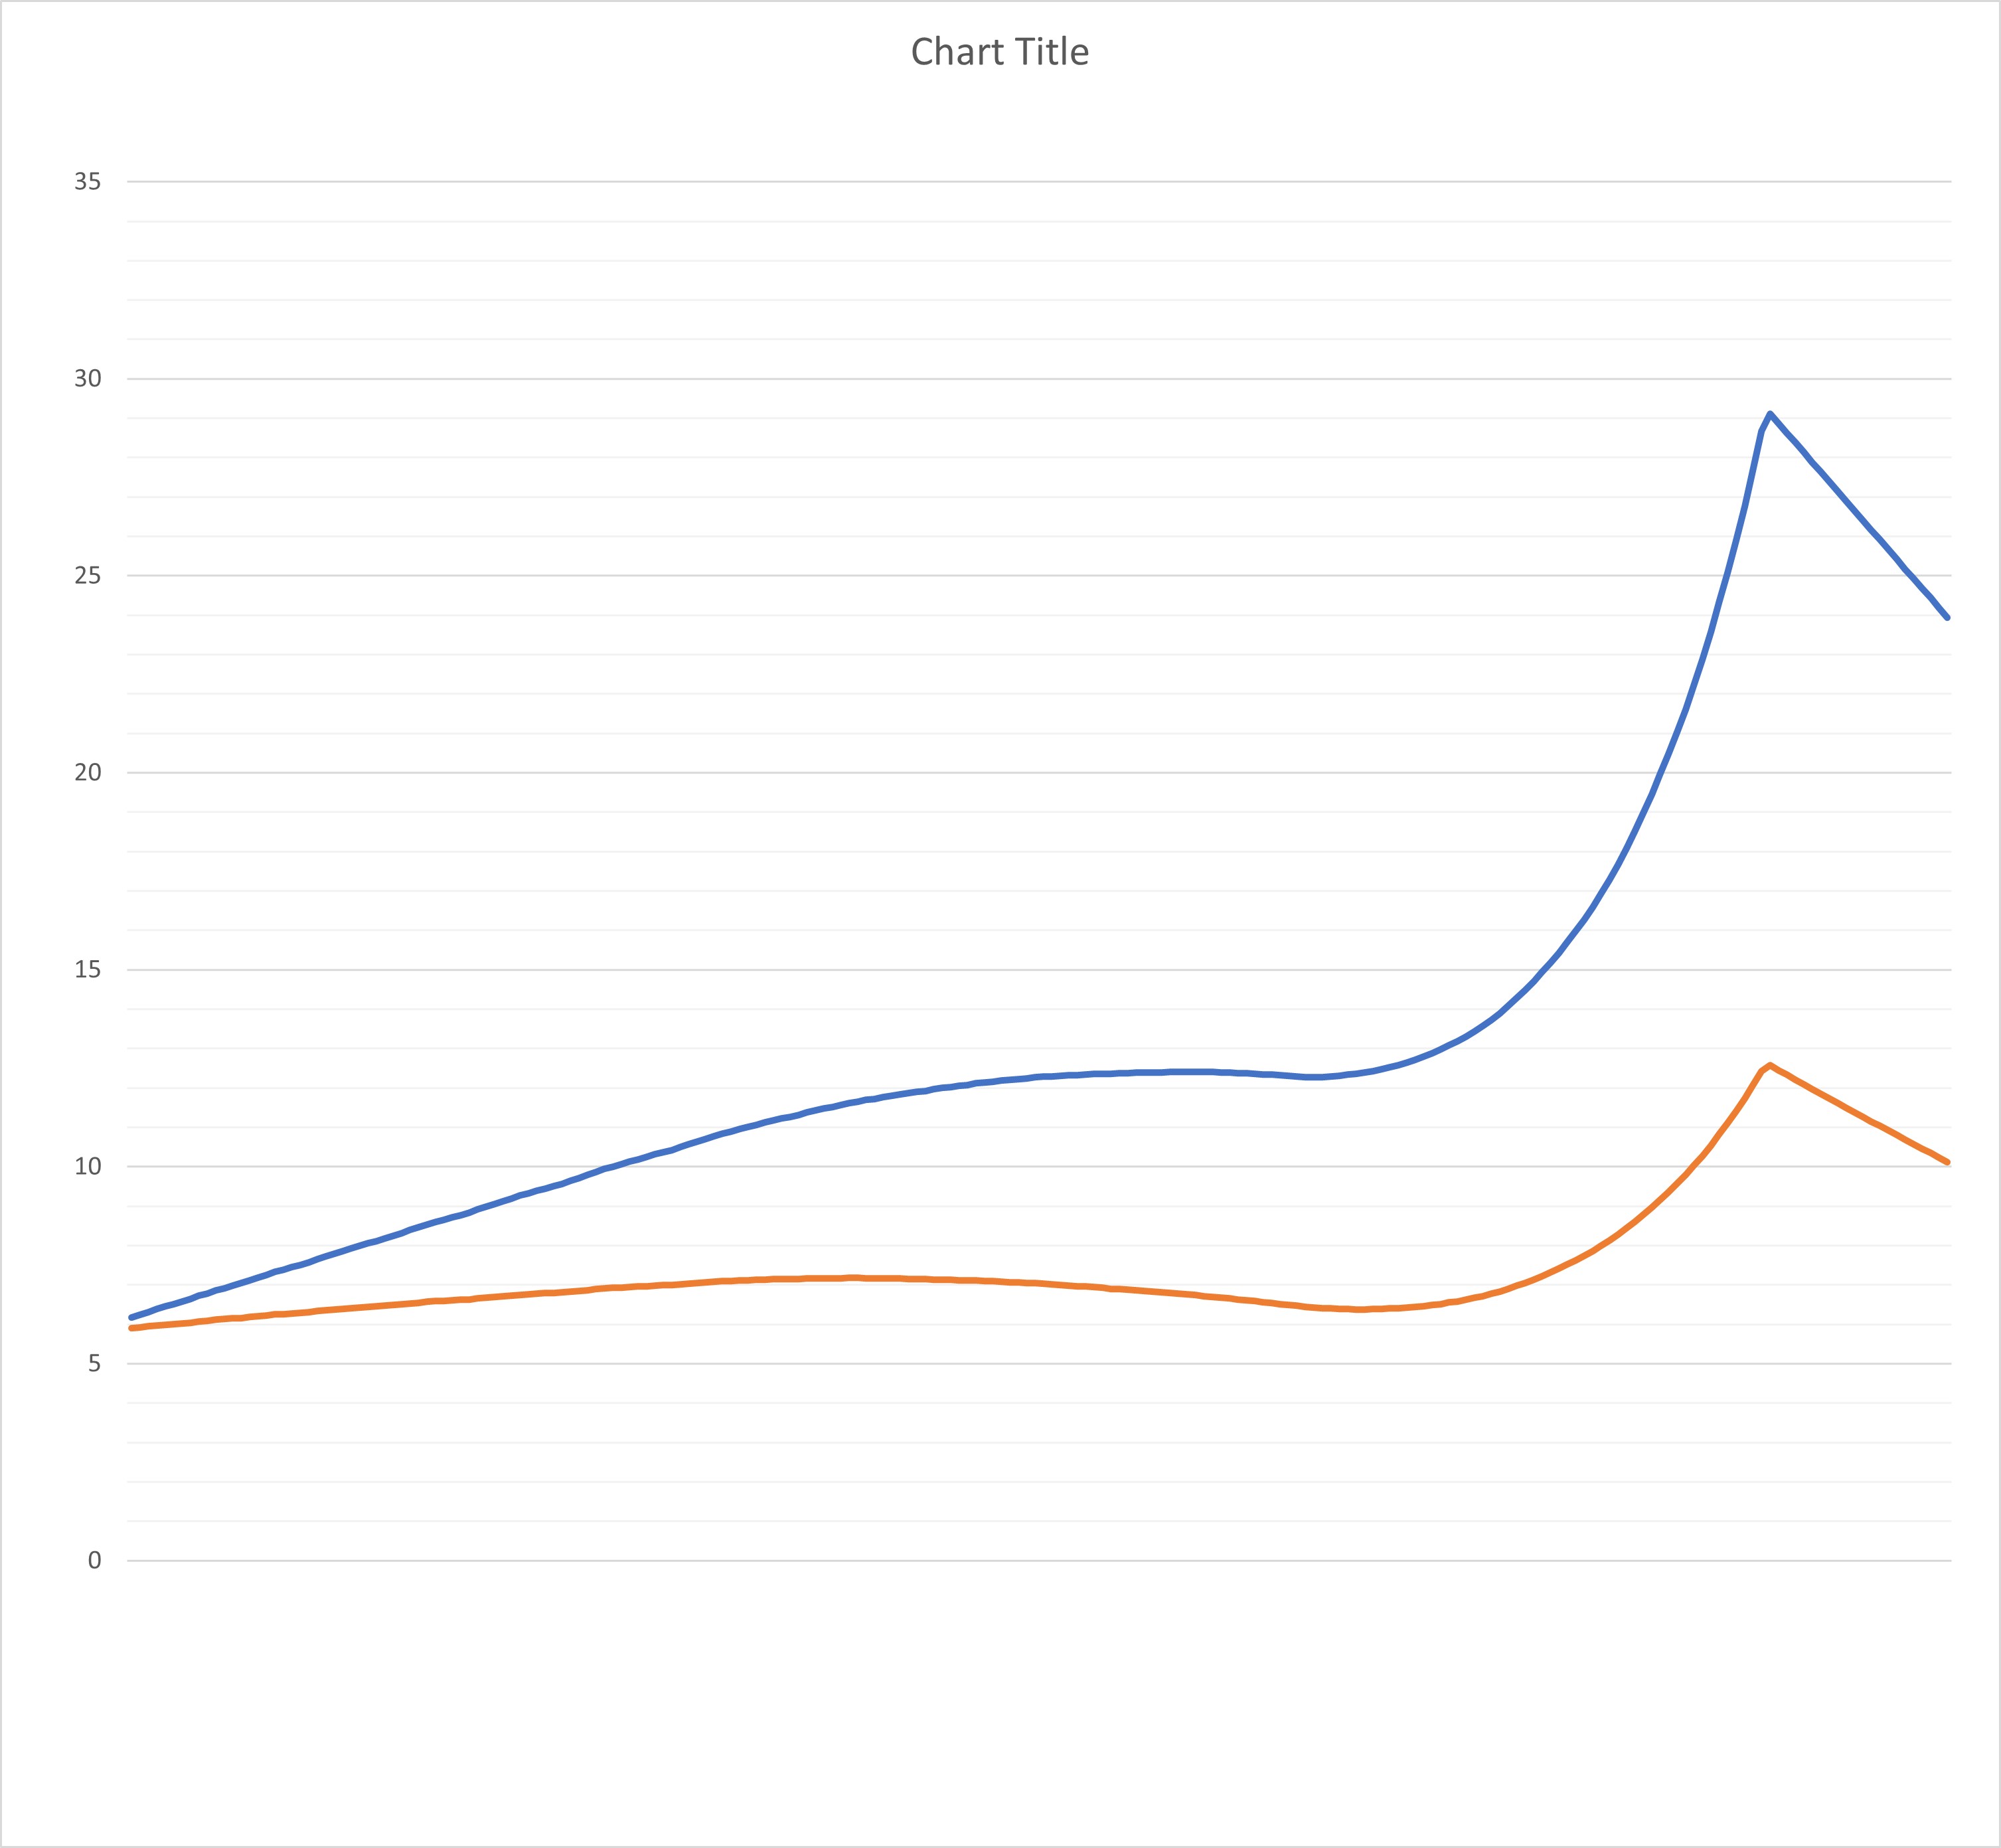
where curves drop down it is where DxO PL6 clips what is not clipped in raw
absolute difference does NOT matter - what matters is the that the difference is VARIABLE - while a proper implementation shall have CONSTANT ( zero, if happens, is constant too ) difference ( accounting for example for hidden “expo”-corrections and stuff like this ) !!!